Time to Value template

The Time to Value template shows how long buyers take to reach a funnel stage and how many contacts, sessions and channels are involved along the way. You can measure the journey from an earlier stage or from the first recorded touch.
How you can use it
- Set realistic goals. Use historical journey lengths to set realistic expectations for how long leads may take to reach the next stage.
- Plan campaigns and follow-ups. If an marketing-qualified lead (MQL) usually takes 30 days to become an sales-qualified lead (SQL), time nurture emails and retargeting to cover that window.
- Align marketing and sales. Give both teams a shared view of journey length and the engagement involved.
- Track improvements. Watch whether journeys get shorter, or need fewer sessions, after a change in process or campaigns.
Start from the template
The template includes a starting set of metrics. You can adjust the stages and date range to suit your question.
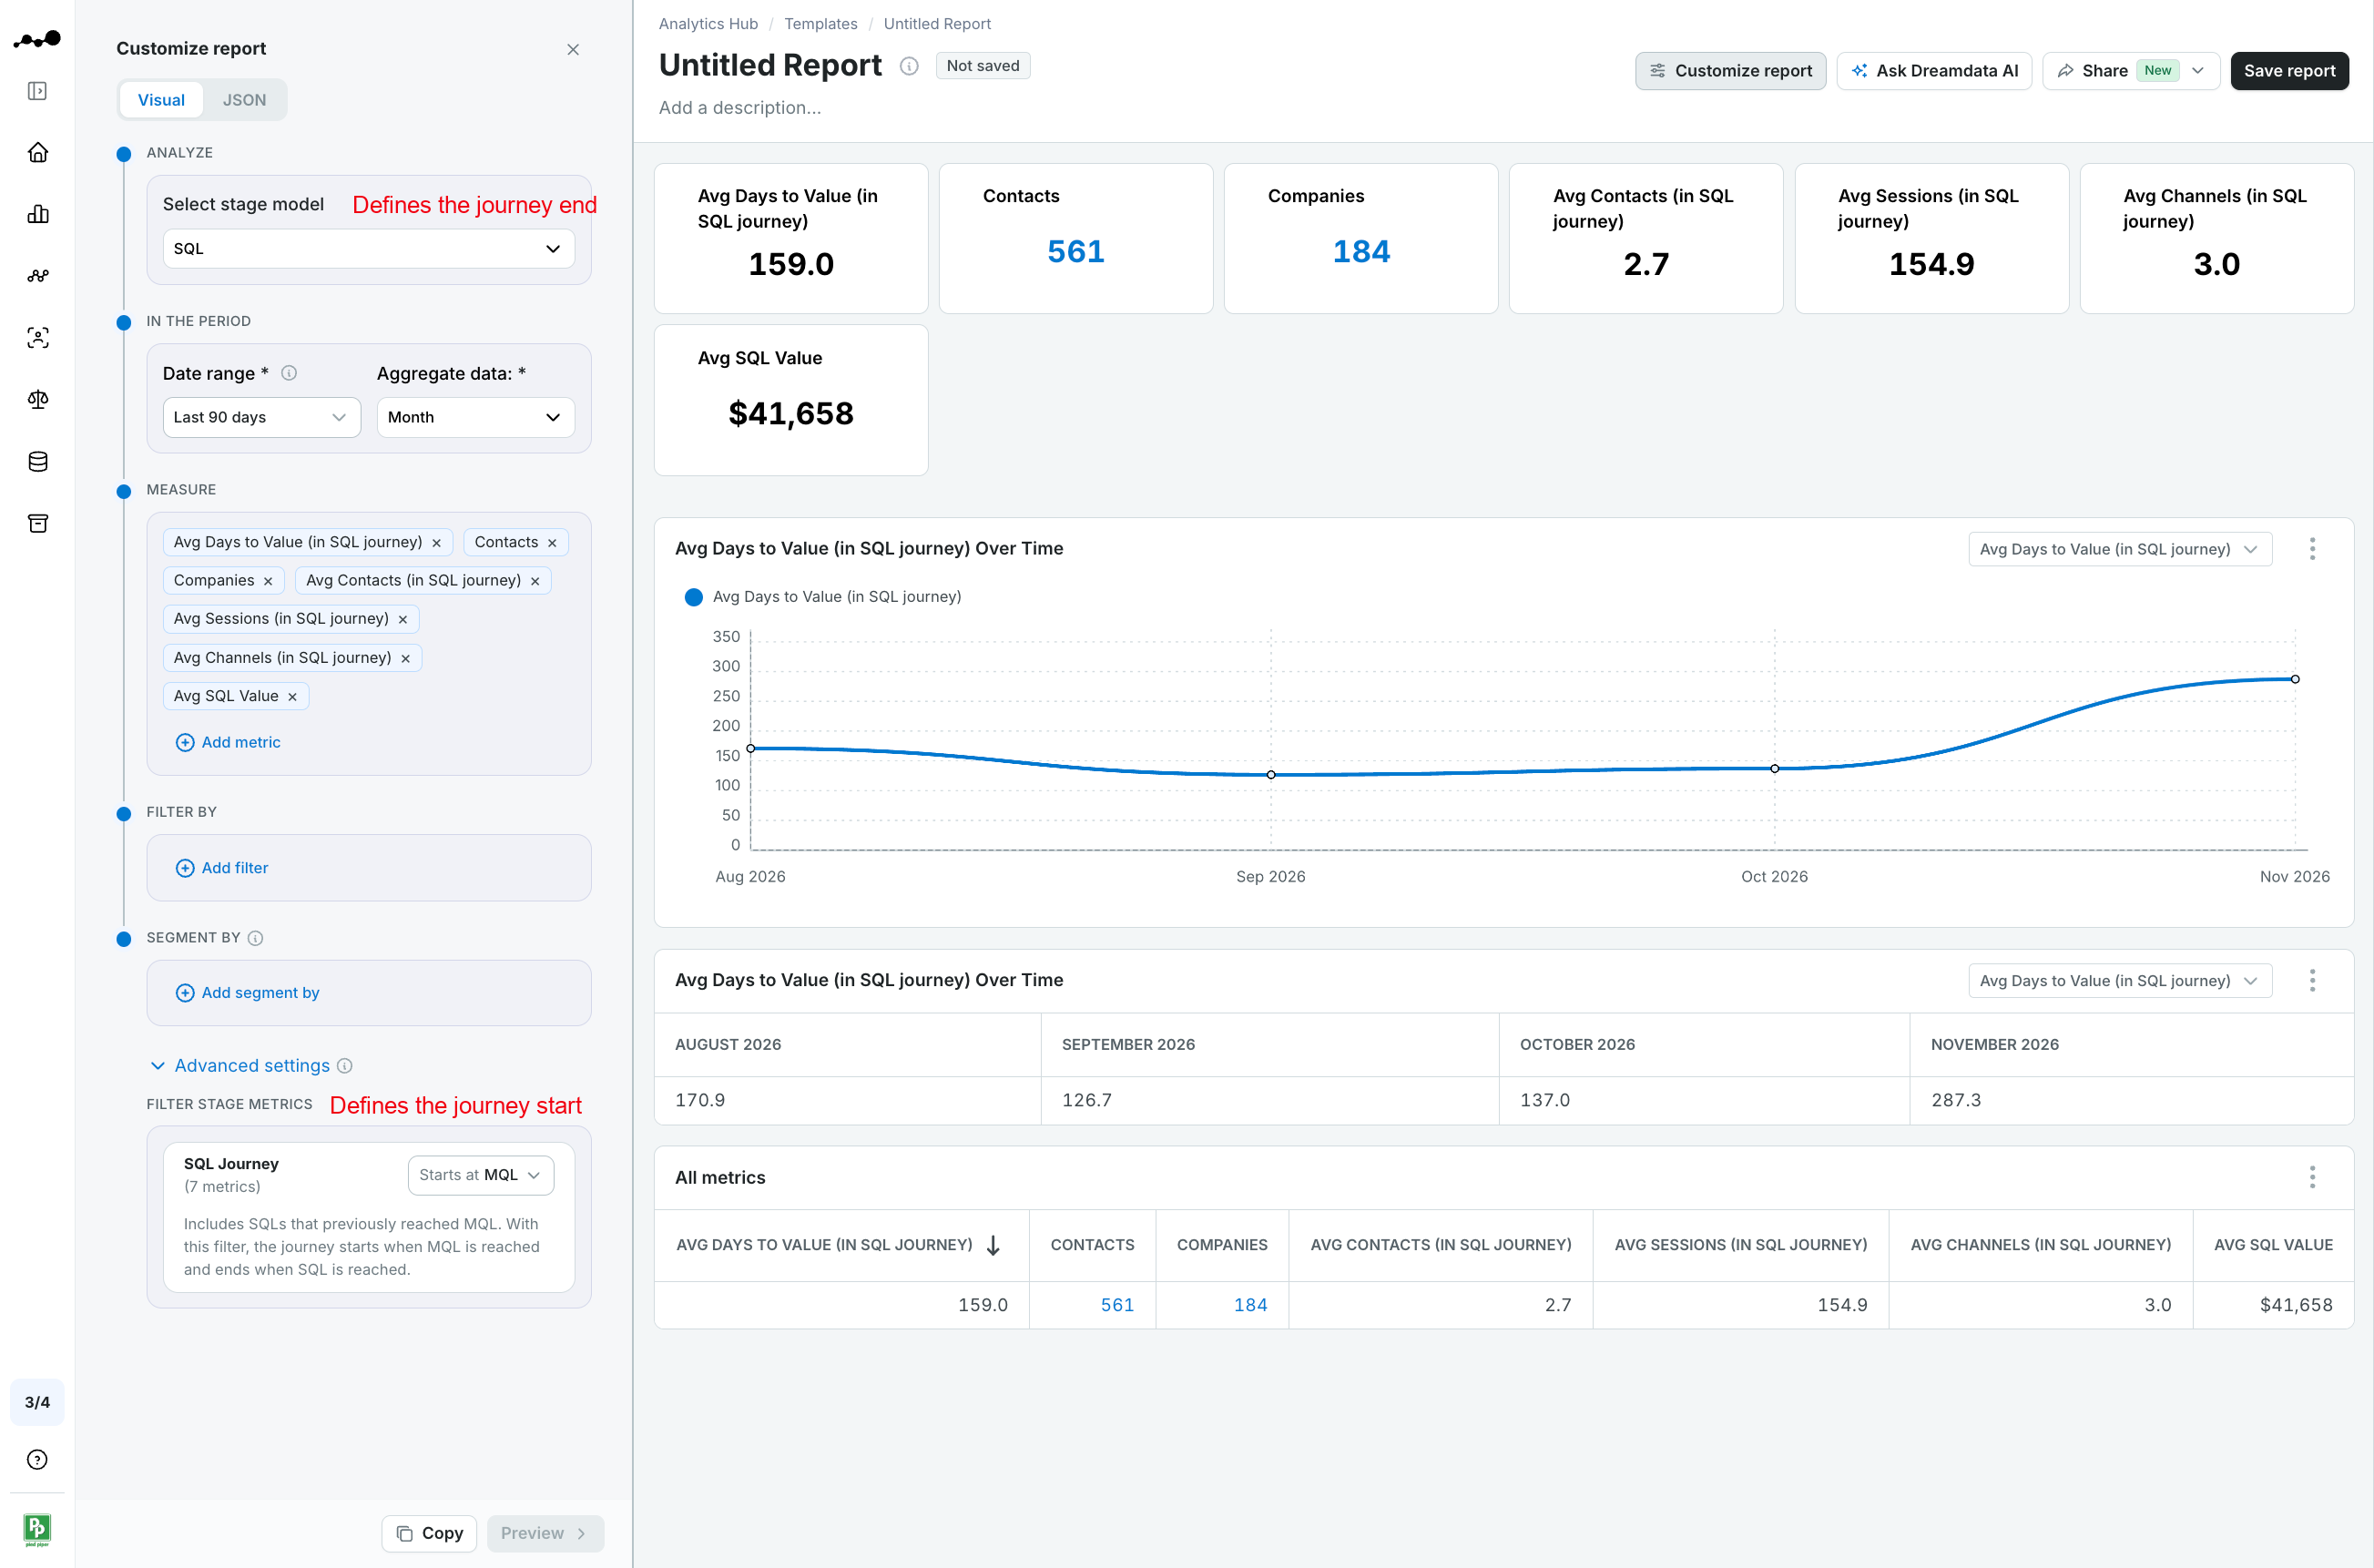
- Go to the Analytics Hub home screen and click Create new > Report.
- In the Template gallery, under Pipeline & funnel, click the Time to Value card.
- Click Use this template. The report opens with the Customize report panel pre-populated.
The template measures the journey from your first funnel stage to your second, for the last 90 days, by month.
You can change any of these in Customize report, then click Preview to run the report:
- The end stage: under Analyze, in Select stage model.
- Where the journey starts: under Advanced settings, at the bottom of the panel. See How a journey is measured below.
- The period: under In the period.
You can also ask the Analytics Agent, for example:
"For the SQLs we reached last quarter, how many days on average did it take them to get there from MQL?"
How a journey is measured
A journey runs from your selected starting point to the end stage. It appears in the period when the end stage was reached.
For example, a journey that starts at MQL in January and reaches SQL in March appears in March’s results.
To choose where the journey starts:
- In Customize report, open Advanced settings.
- Under Filter stage metrics, find the journey card, such as SQL Journey.
- In Starts at, select First touch or a stage.
Your choice determines where each journey begins and which records are included. The table below shows the options when SQL is the end stage.
Starts at | How the journey is measured |
First touch | Includes all SQLs matching the report filters. The journey starts at the first recorded event linked to each SQL and ends when SQL is reached. |
MQL (or any other stage) | Includes SQLs that previously reached MQL. With this filter, the journey starts when MQL is reached and ends when SQL is reached. |
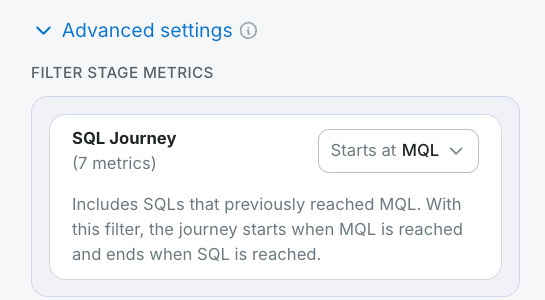
The template starts the journey at your first funnel stage. To measure from the first touch instead, pick First touch in the same menu.
Two consequences worth knowing:
- The two options measure different samples. With Starts at MQL, the report includes only SQLs that previously reached MQL; SQLs that never reached MQL are left out. Compare numbers only between reports that use the same start.
- When the journey starts at MQL, only sessions that begin at or after the MQL stage is reached are included. A session that started earlier is excluded, even if it continues after that point.
Example: A session starts at 09:00, and the contact becomes an MQL at 09:10. Because the session started before the contact became an MQL, it is excluded.
Metrics
For average journey metrics, Dreamdata first averages the journeys for each record, then averages those results. Each record has equal weight, regardless of how many journeys it has.
Unusually long journeys or high engagement can still raise an average.
Metric | What it shows |
Avg Days to Value | Average number of days from the start of the journey to the day the record reached the end stage. It is time to the end stage you chose, so it is "time to close" only when the end stage is Closed Won. |
Contacts | Number of distinct contacts in the journeys in the period. A total, not an average. |
Companies | Number of distinct companies in the journeys in the period. A total, not an average. |
Avg Contacts | Average number of distinct contacts per journey. |
Avg Sessions | Average number of distinct sessions per journey. |
Avg Channels | Average number of distinct channels across the sessions of each journey. |
Avg Value | Average value of the end-stage records reached in the period. Records without a value are left out. It is the value of the stage, not revenue the journey generated. |

Track the journey over time
The chart and table show each metric per period. Change the period length (week, month, quarter) and the date range in the report settings.
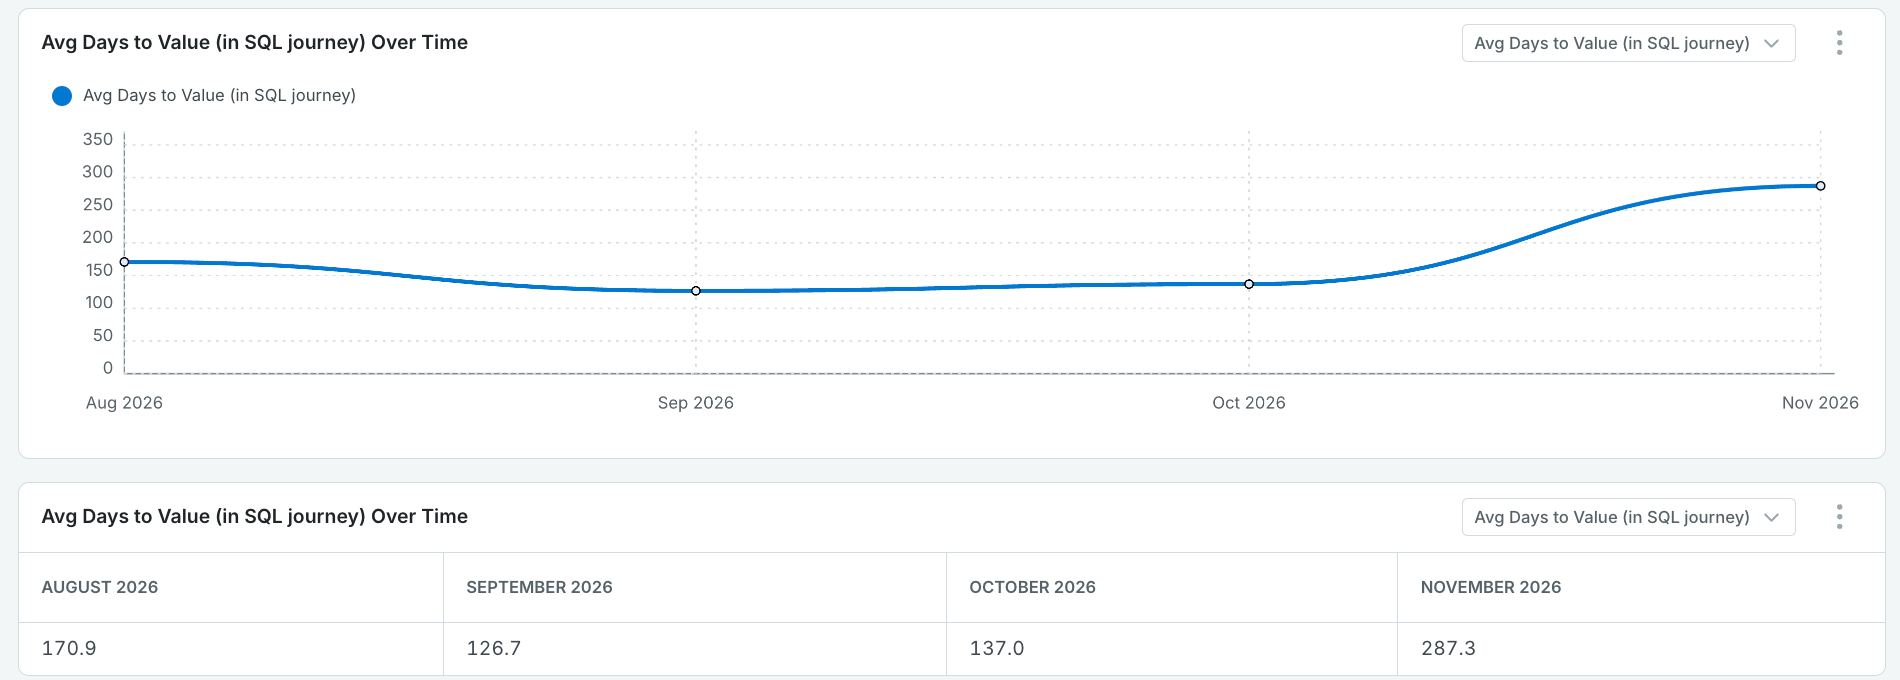
Long journeys can raise the average. These are mean averages, not medians. A monthly increase can happen when journeys that started much earlier reach the end stage during that month.
When comparing periods or segments, keep the same start and end stages. With only a few completed journeys, one unusually long journey can have a large effect on the average.
Break it down by segment
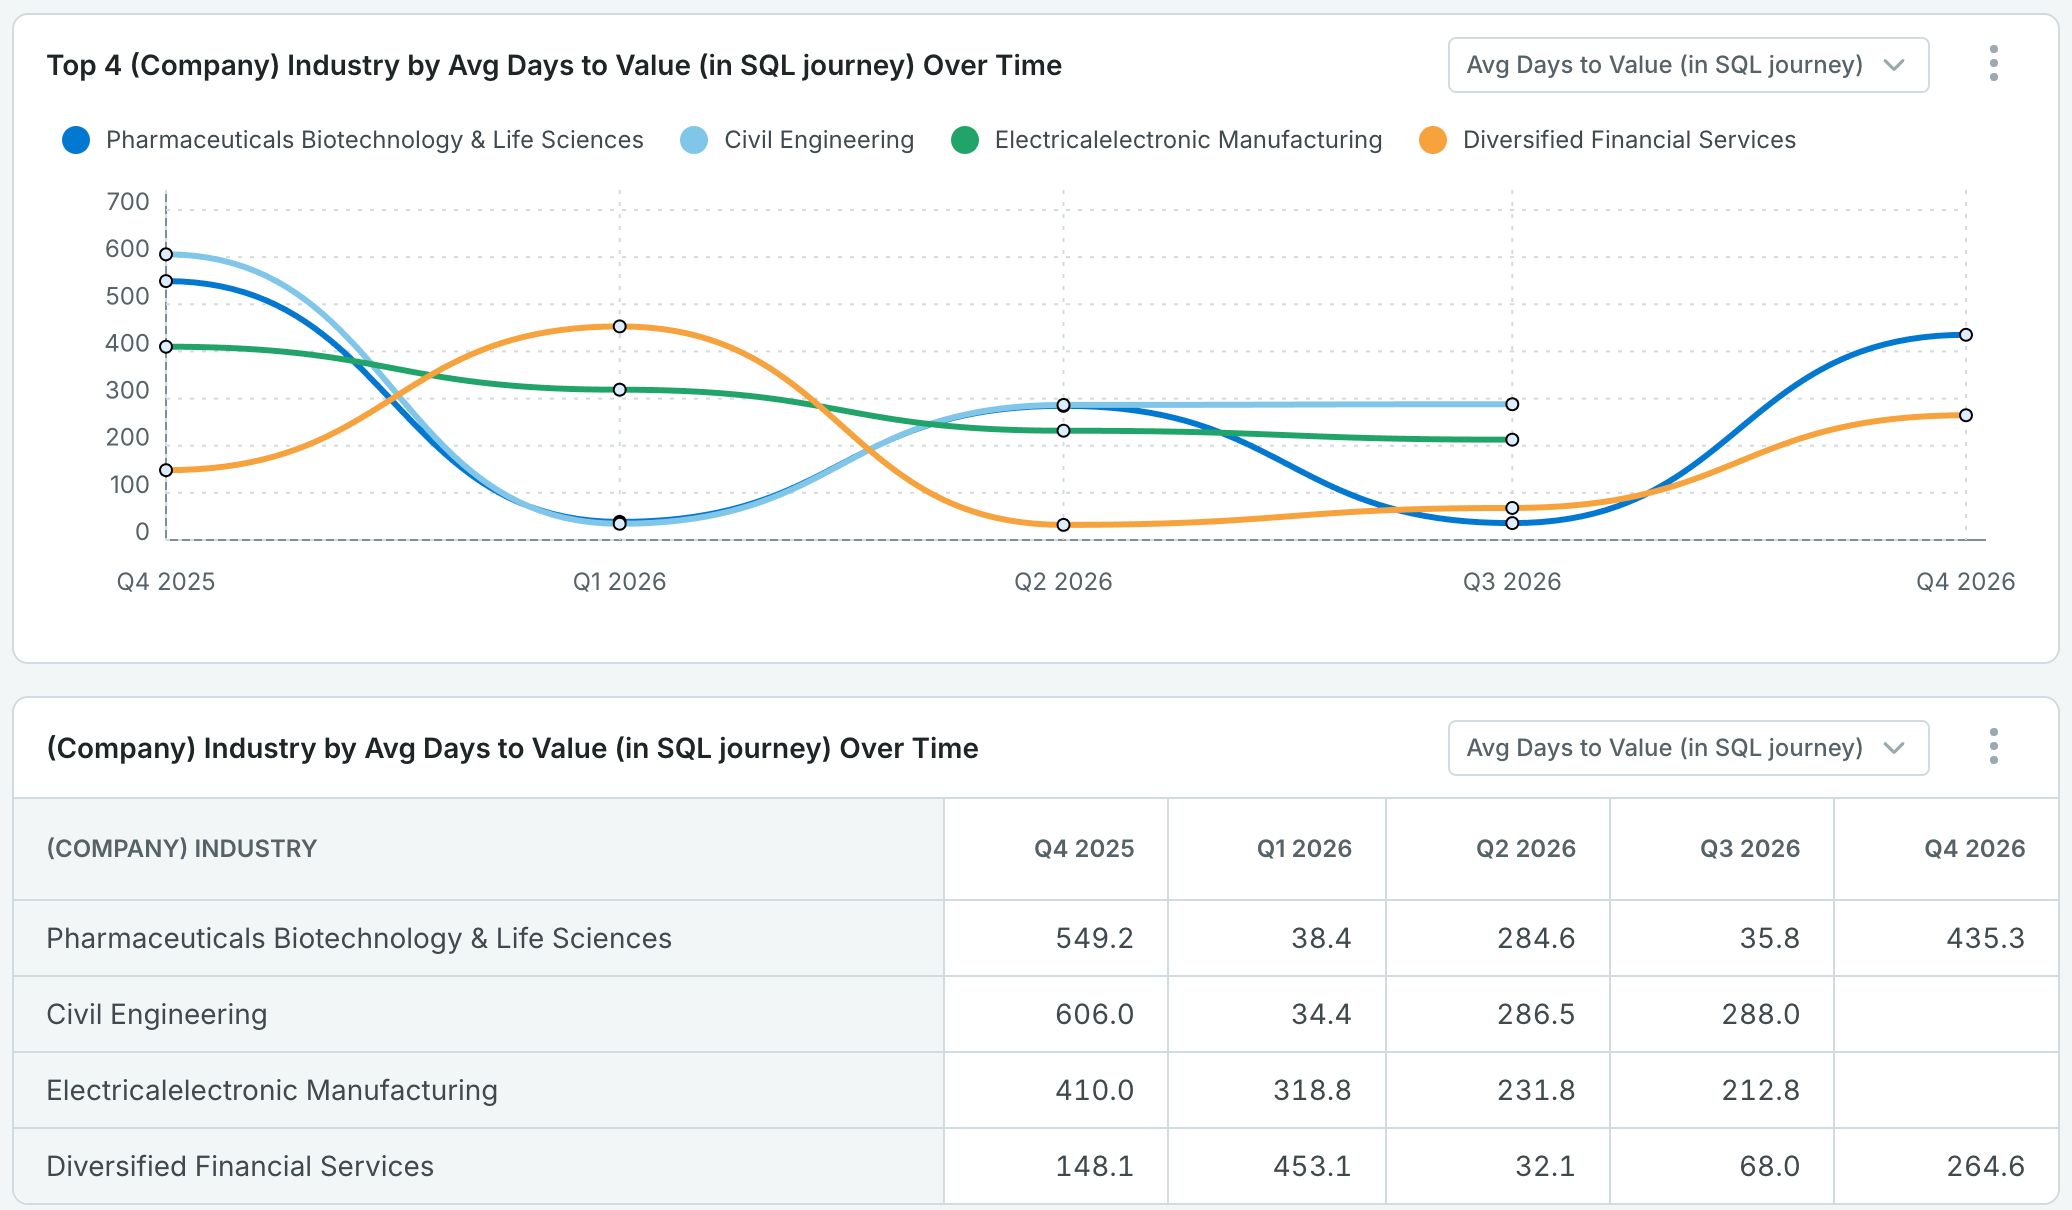
Add a segment, such as industry, country or company size, to compare journeys across groups. Each row then shows the journeys whose records belong to that segment.
To compare a few segments side by side, also add a filter under Filter by with only the values you want, for example four industries. The example below shows those four industries by quarter over the last 12 months.
Next steps
Open the template, choose the stage you want to reach, and pick where the journey starts. Save the report to come back to it, and rerun it as new journeys complete, to see how long your buyers take and what it takes to move them forward.
For a quick answer, ask the Analytics Agent in the report, for example "How many days did SQLs take from MQL last quarter?".
