Return on Ads Spend (ROAS)
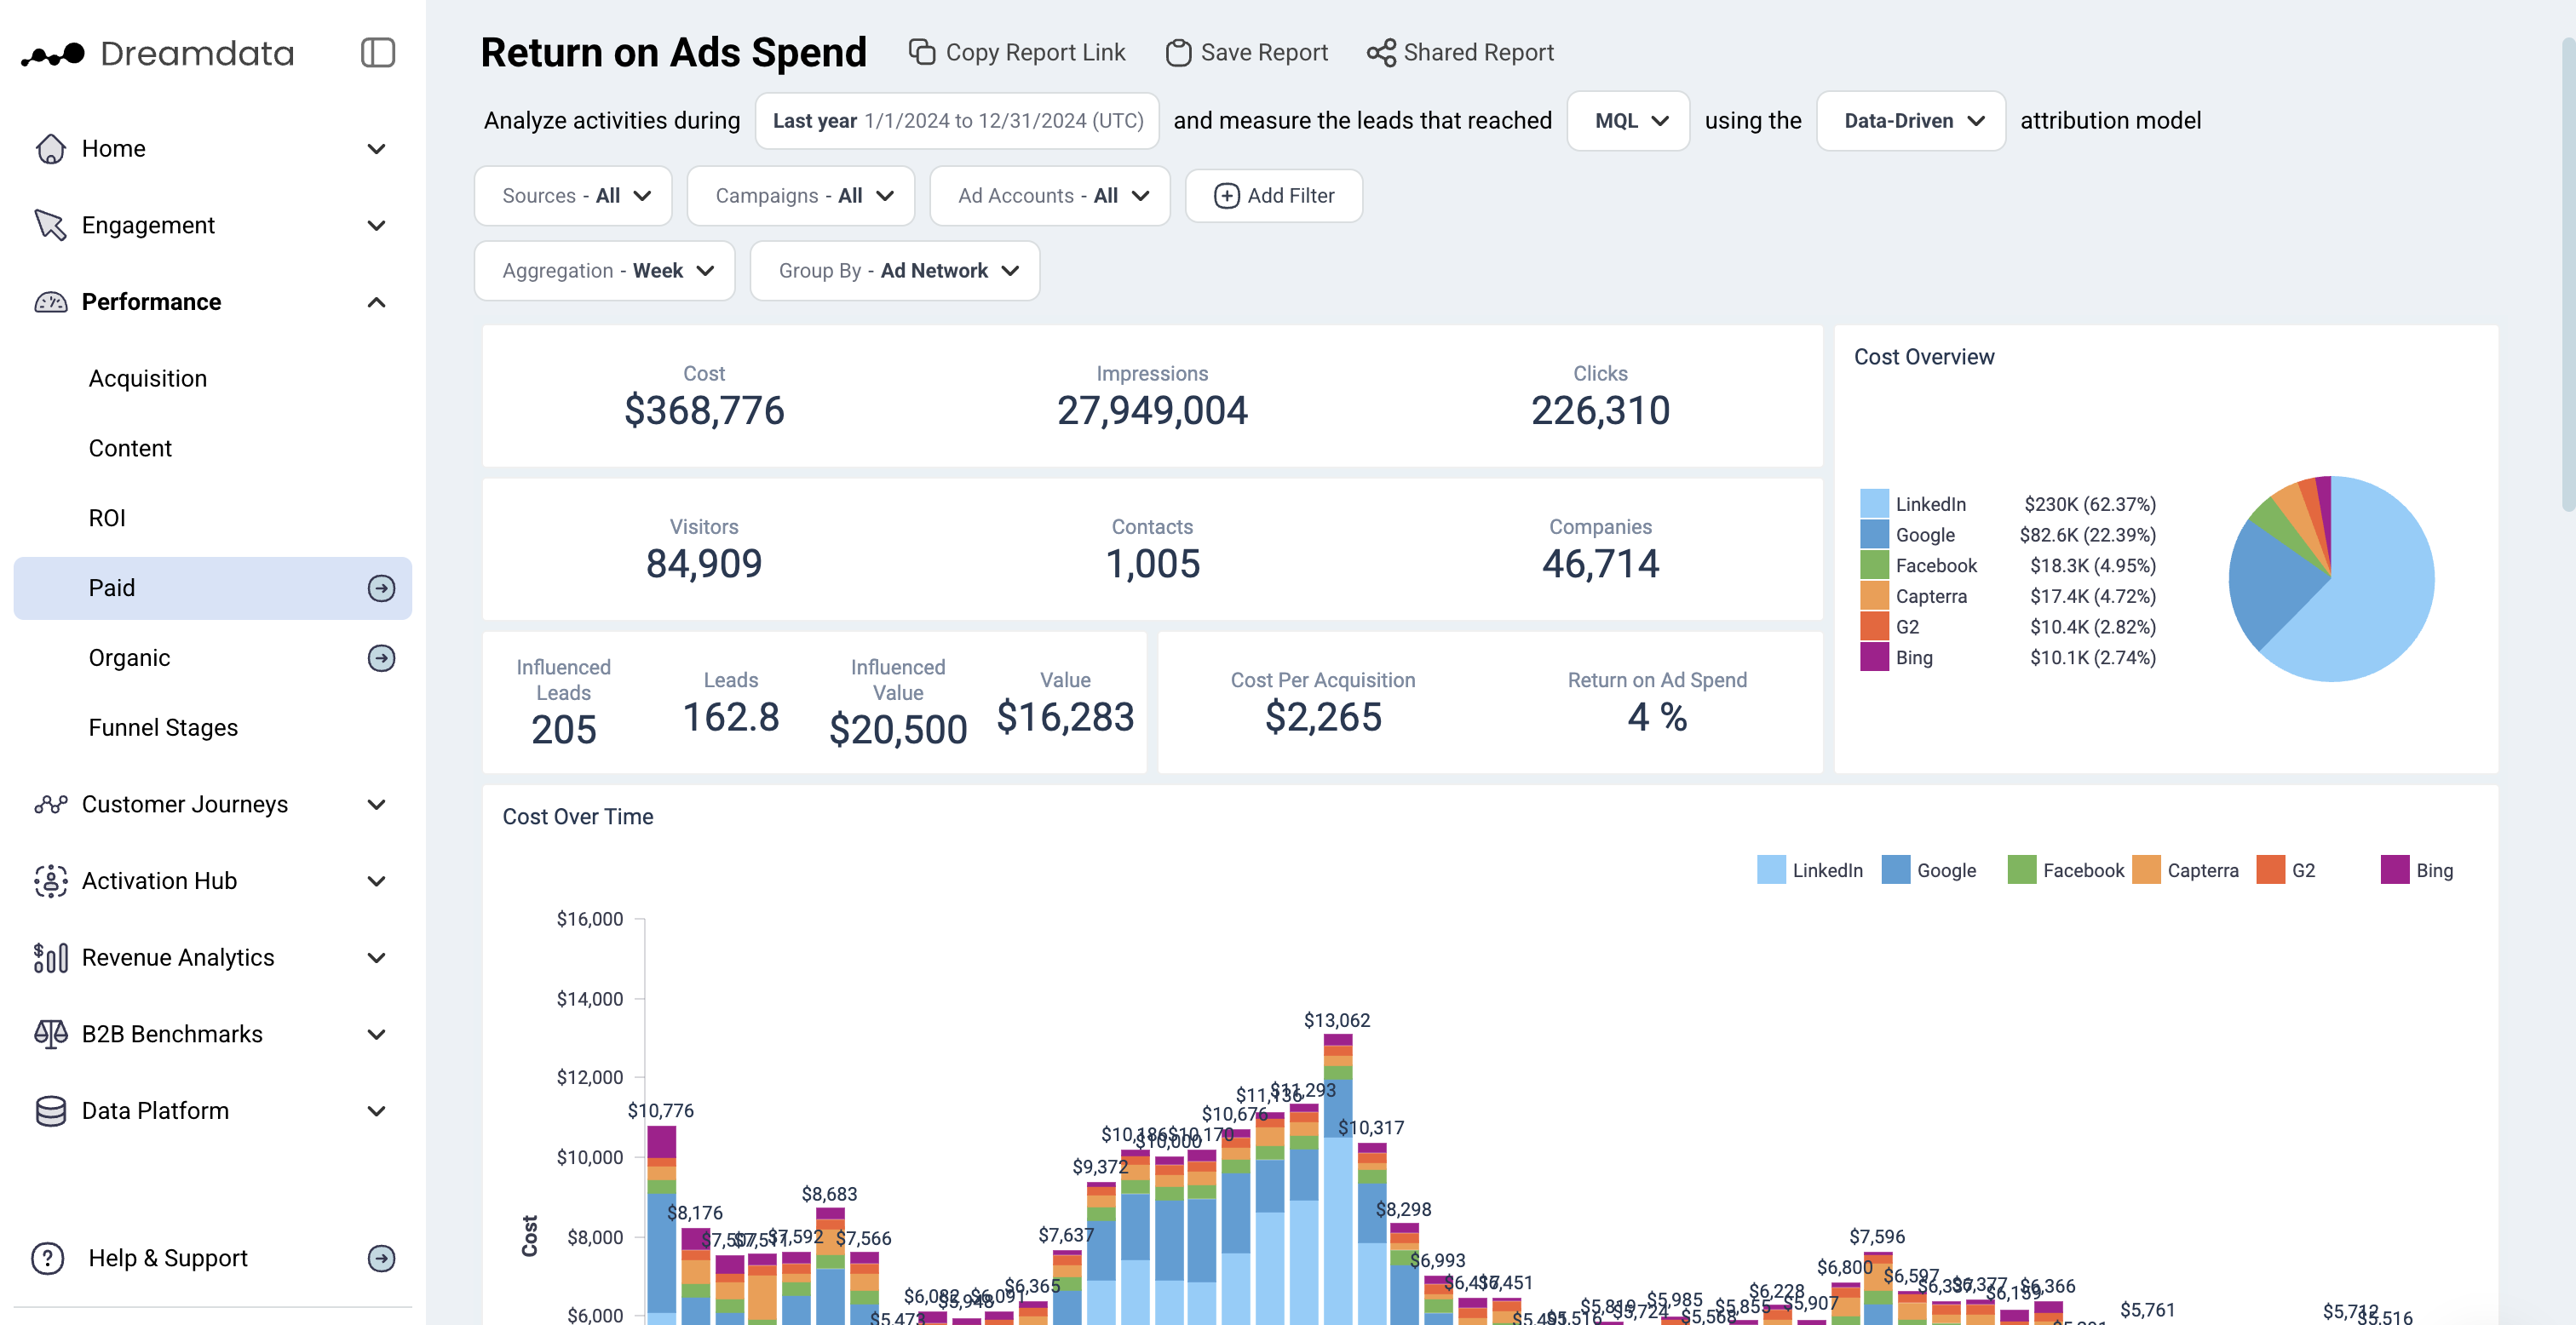
On the ROAS dashboard, you can see how much Revenue is being generated from all your Paid Ad Activities and the subsequent Return on Ads Spend percentage. We breakdown the entire funnel from Impressions down to Cost per Acquisition.
Furthermore, we show how your investments perform over time. We also list all the different Ad Networks and their individual contributions. This dashboard gives the ability to better understand and report on Ad performance.
Filters
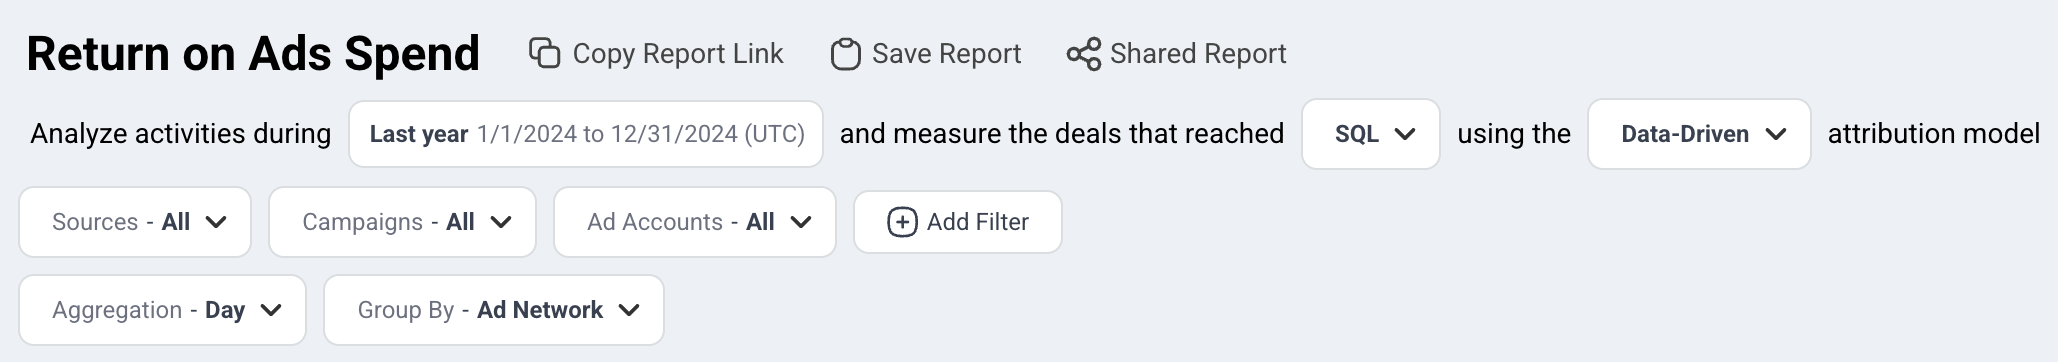
Date: Set the time period you want to investigate
Stage: You can select your preferred pipeline stage. Read more about the Free Tier Stages here
Attribution: Choose the attribution model which is meaningful for your analysis
- First Touch
- Last Touch
- Linear
- U-Shaped
- W-Shaped
- Data-driven
Sources: Choose the ad network
Campaigns: Choose the campaign you want to investigate
Ad Accounts: Choose the ad account/s you are interested in
Aggregation: Set the time frames you wish to display your data in
Group By: Choose your preferred option to group by
- Ad Network
- Campaign
- Branded Search
- Ad Account
Note: Date is referring to the time period when visitors/contacts interacted with these Ad Networks
Metrics
Cost: The total spent on Paid Ad Campaigns across the different Ad Networks/Sources
Impressions: The number of times your ad is shown - each time your ad appears on someone's feed it is counted as an impression
Clicks: The total amount of clicks seen across the different Ad Networks
Visitors: The number of unique users who had a website session which originated from different Ad Networks during the given time period
Contacts: The number of visitors who we have been able to attach an email to their user id
Companies: The number of companies who are attached to Contacts, or the number of companies in your CRM who we can be attached to any visitor traffic (anonymous)
Deals: The number of deals that are associated with Paid Ad Networks based on your selected filter
Value: The amount of revenue than is attributed to Paid Ad Networks based on your selected filter
Cost Per Mille (cpm): Cost per thousand. This calculation is used to denote the price over one thousand impressions
Click Through Rate (ctr): Clicks divided by Impressions
Cost Per Click (cpc): Total Cost divided by Clicks
Cost Per Acquisition (cpa): Total Cost divided by Attributable Deals
Return on Ad Spend (ROAS): Total Attributable Revenue divided by Total Cost
Funnel Overview
Cost → Impressions → Clicks
In this first section, we provide the top of the funnel for all your Paid Ad Activities. This data is pulled directly from the Ad Network through our integrations.
Visitors → Contacts → Companies
In the next section, we give an overview of the traffic from your Paid Channel which is based on the Tracking script we have on your websites.
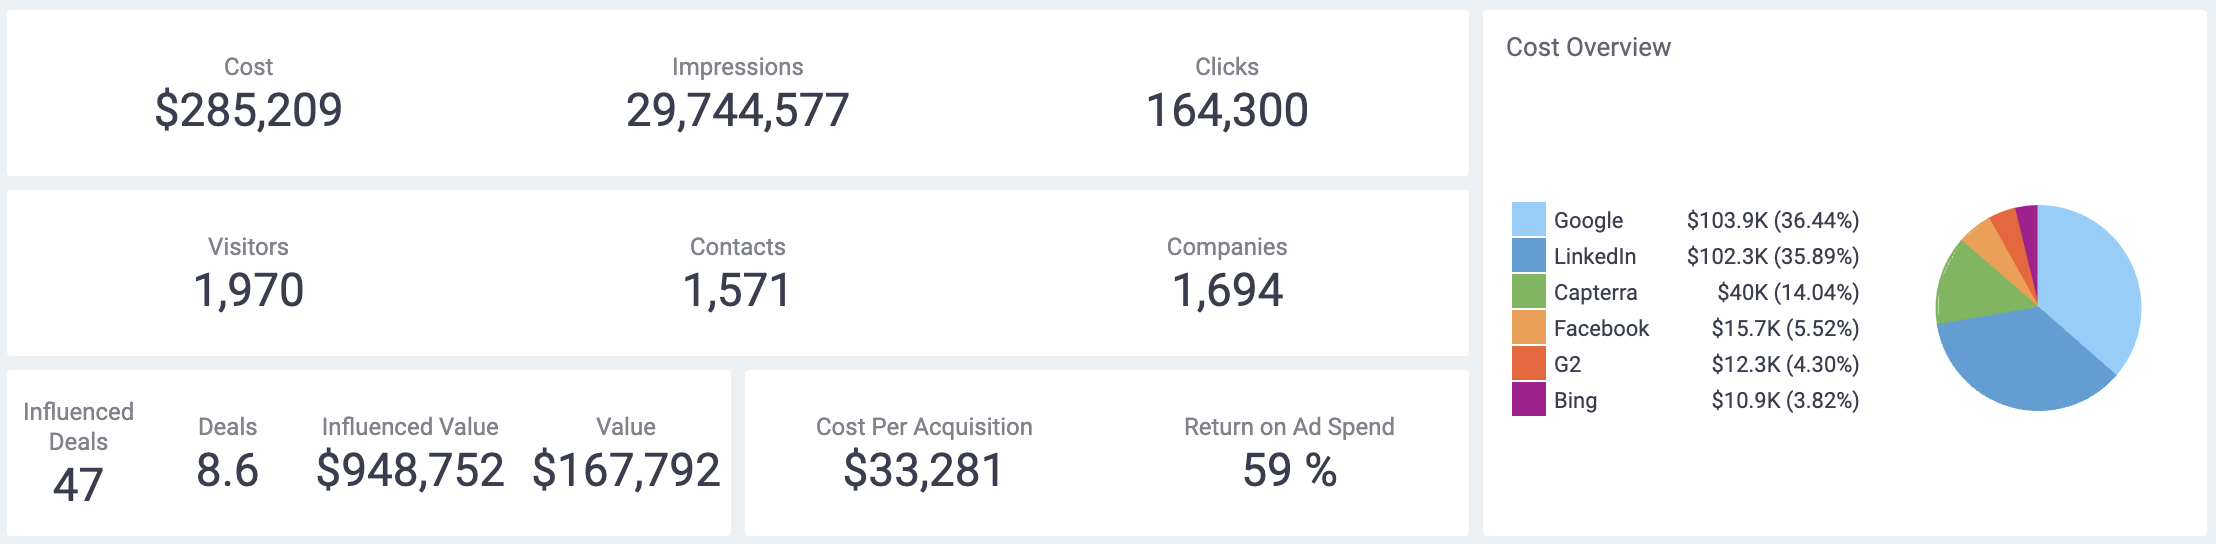
Influenced Deals → Deals → Influenced Value → Value
Influenced Deals & Influenced Value: The number of deals who had a touchpoint in its journey and the value (revenue) of those deals - based on the dates/filters selected. These two metrics are not controlled by your selected attribution model but do take into consideration your stage model settings.
Deals: The number of deals who had a touchpoint in this journey BUT with the attribution model applied - based on the dates/filters selected. The attribution model you have selected is applied to each deal and all their paid channel sessions.
Value: The value (revenue) of the calculated attributable deals.
Cost per Acquisition → ROAS
On the fourth row, we provide percentages for CPA and most important Return on Ad Spend.
Graphs and Tables
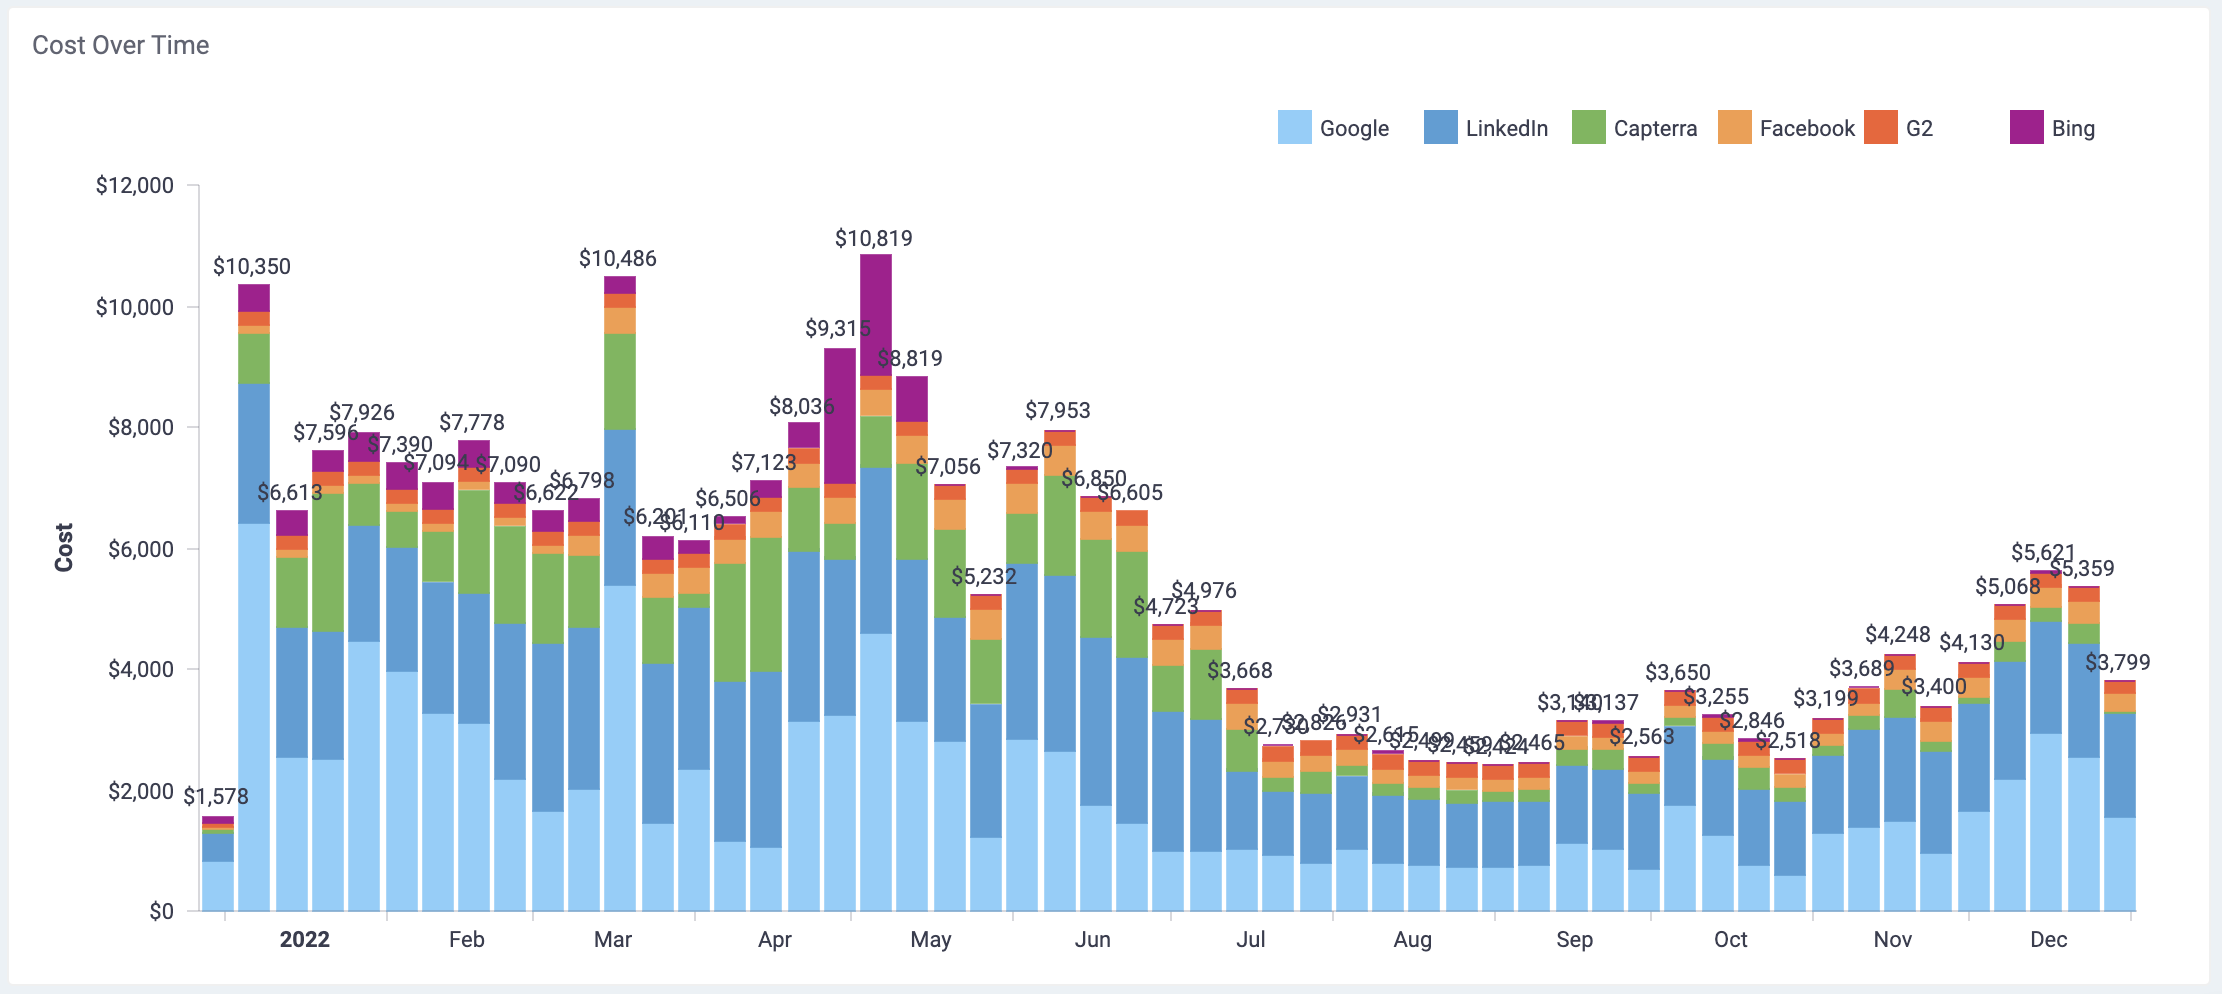
Cost over time
Return on Ad Spend
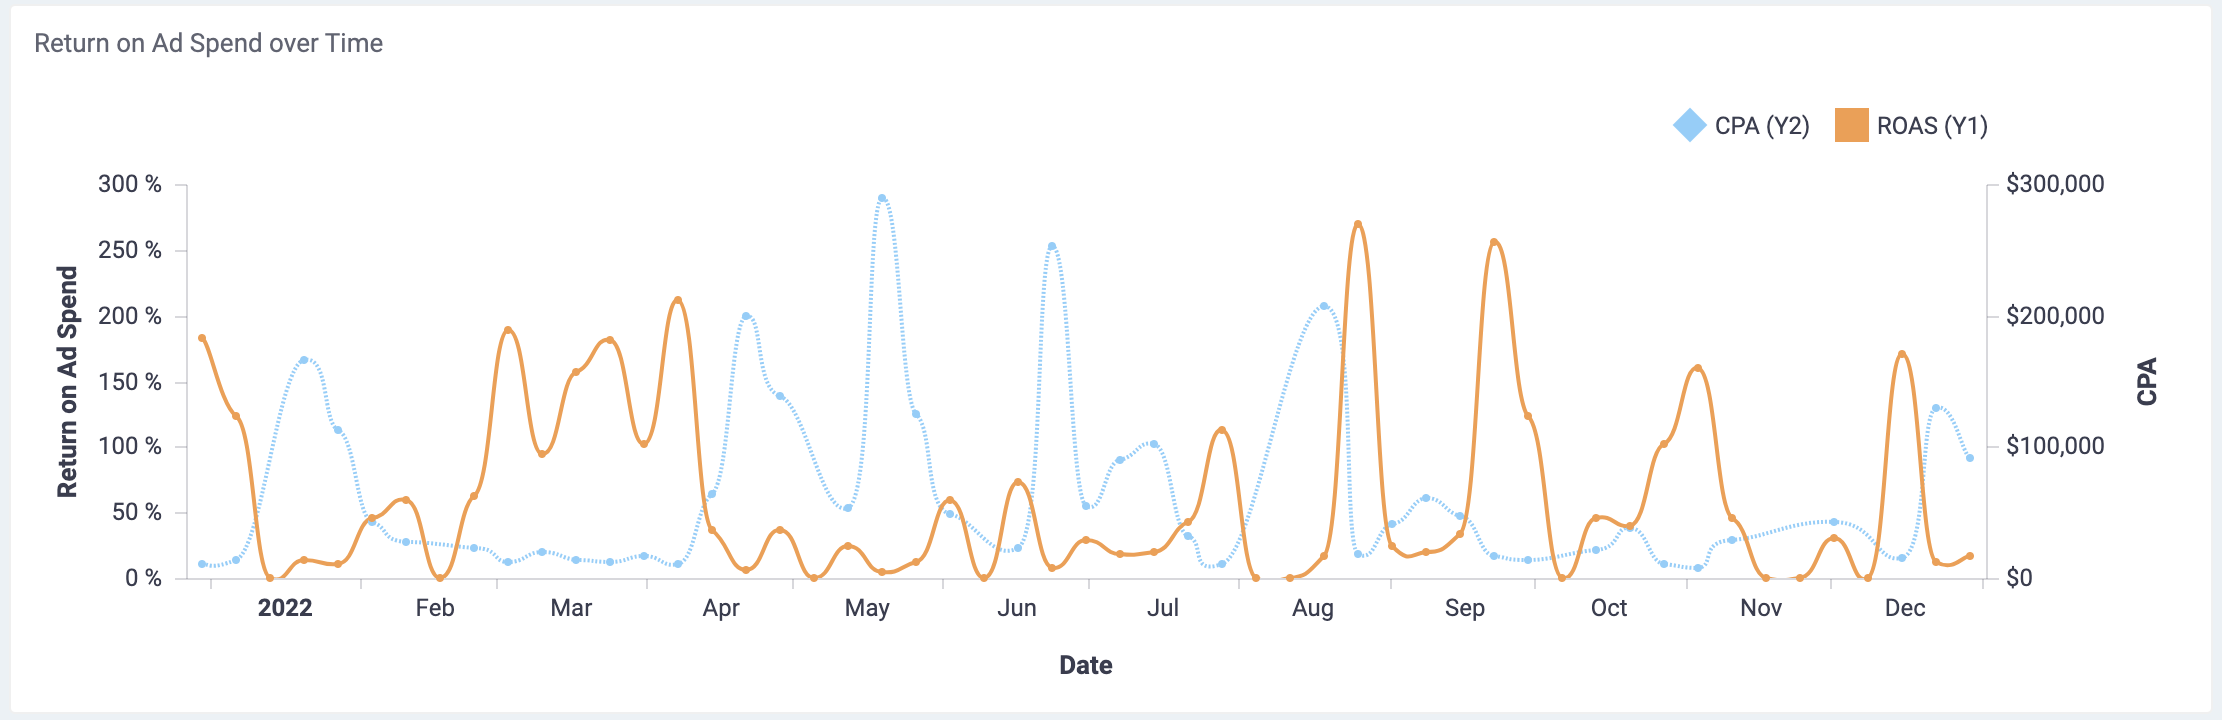
We provide a graph showing the development of the Return on Ad Spend for each Ad Network over the period of time specified in your Filters. Use the Aggregate filter to breakdown the X-Axis as you wish.
This graph makes it easy to see which Ad Network is performing best, but also it shows clearly how long it generally takes for your Ads to mature and provide a Return.
Note: Time frame is key so you should give enough time for your Ads to create value.
Ad Network Performance over time
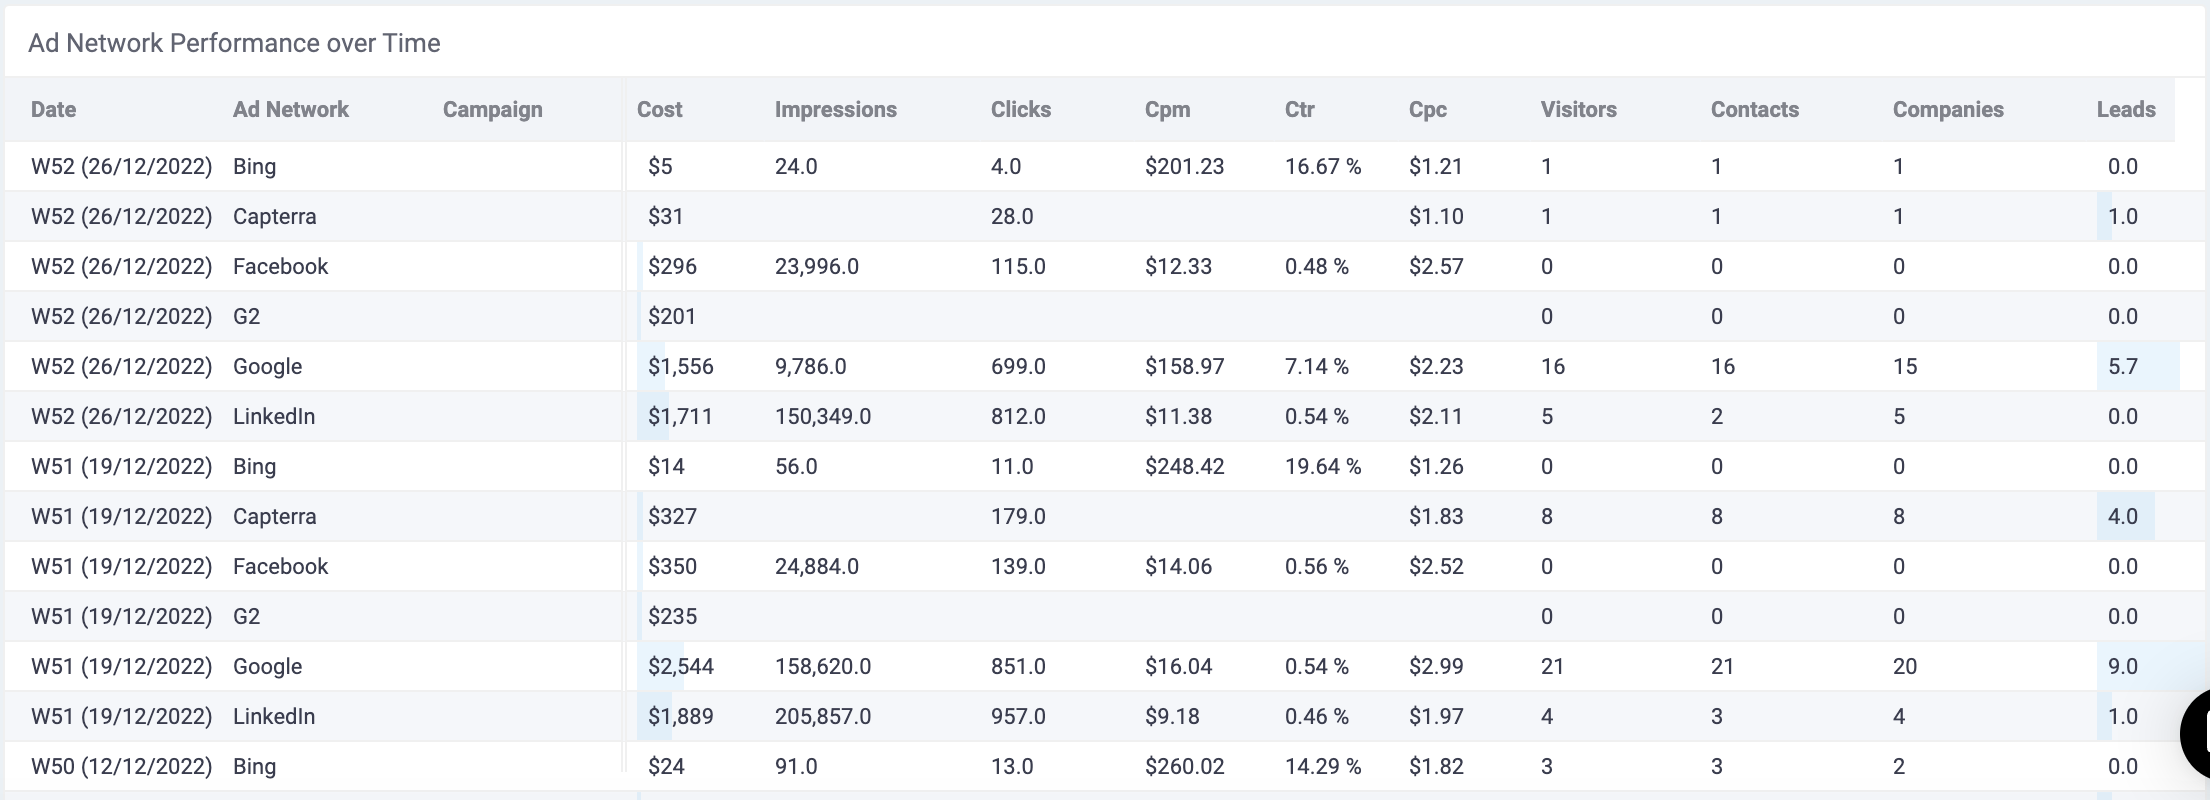
This table lists each Ad Network and their specific performances for a certain timeframe, which is dependent on the Date and Aggregate filter. This report helps to evaluate the business outcomes generated through different Paid Ad Networks.
Questions
I am seeing more clicks than visitors: this is normal, one visitor can have multiple clicks. Also consider that the clicks come from our ad integration and the visitors are from tracking.
I am seeing more visitors than clicks: less normal. Could be caused by mapping channels to advertisement in the ROI import sheet.