Attribution Models- dashboard explanation
This dashboard gives a better understanding of which Channels are driving the most Deals and/or Value of the chosen stage model. Attribution models can help you make data-supported decisions and strategy.
Read more about Attribution Models here and here.
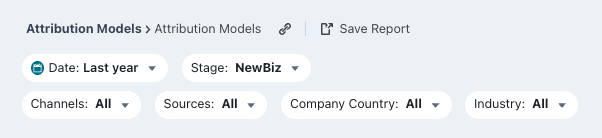
Filters
Date: Set the time period you want to investigate
Stage: You can select your preferred pipeline stage. Read more about the Free Tier Stages here
Channels: Choose the channels you want to analyse
Sources: Choose the sources you want to investigate
Country: Choose the country you want to analyse
Industry: Choose the industry you want to investigate
Graphs and Tables
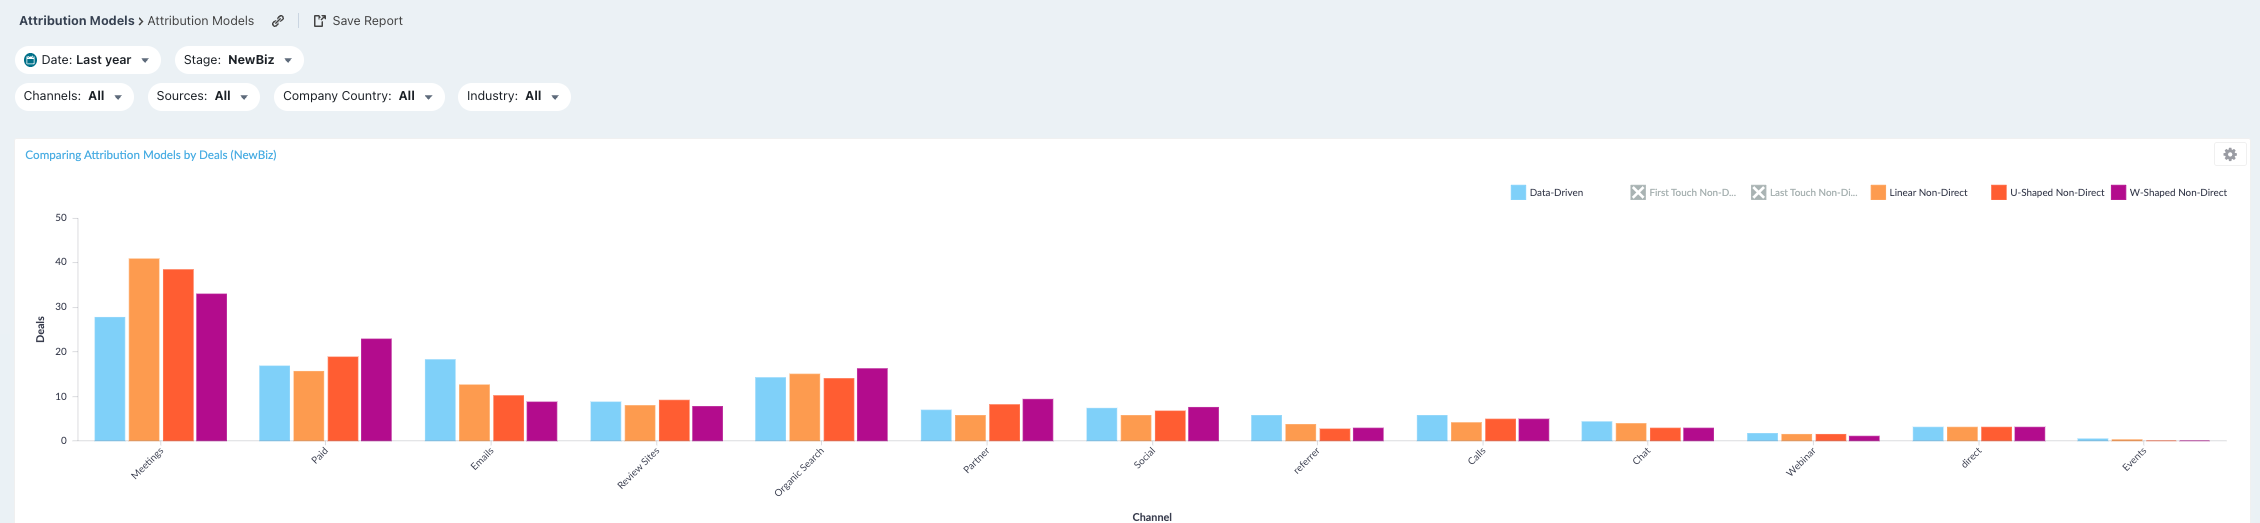
Comparing Attribution Models by Deals
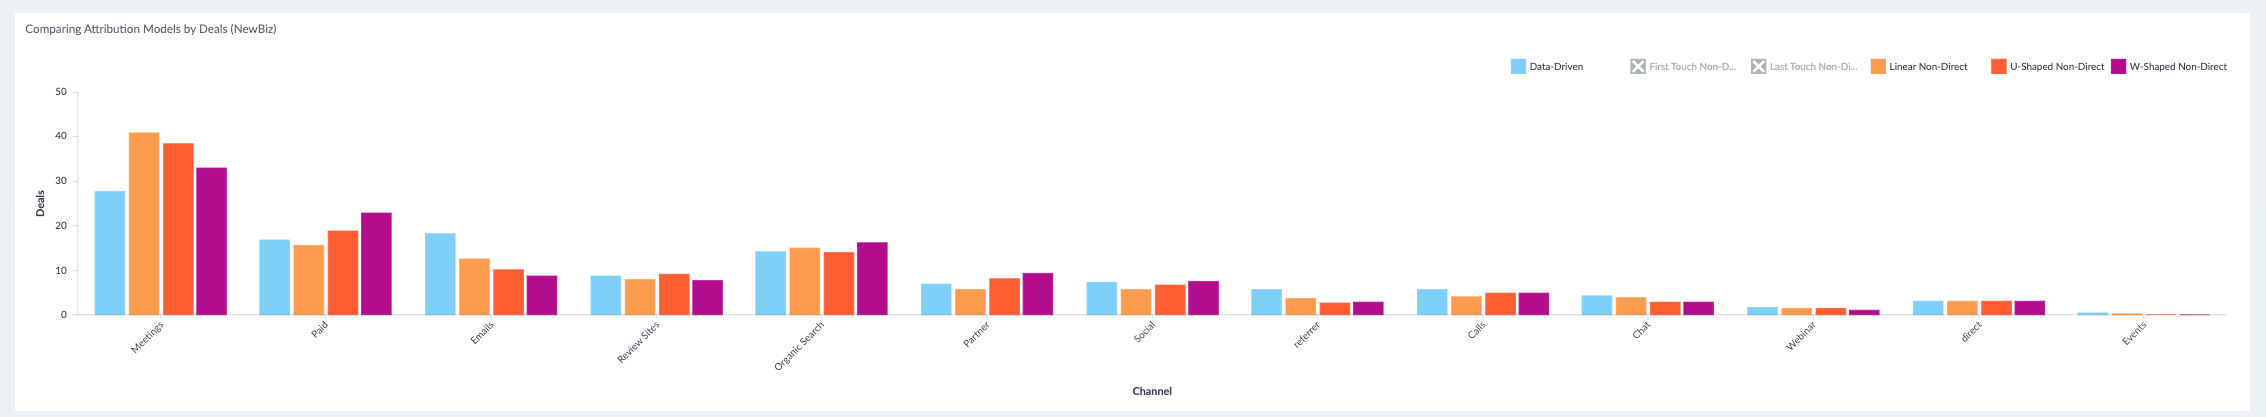
In this graph, we list all the Channels used by your Deals. Attribution Models provide an indication of which channels have the greatest contribution to Deals generation. Remember to adjust the Stage filter according to the purpose of your analysis.
Comparing Attribution Models by Value
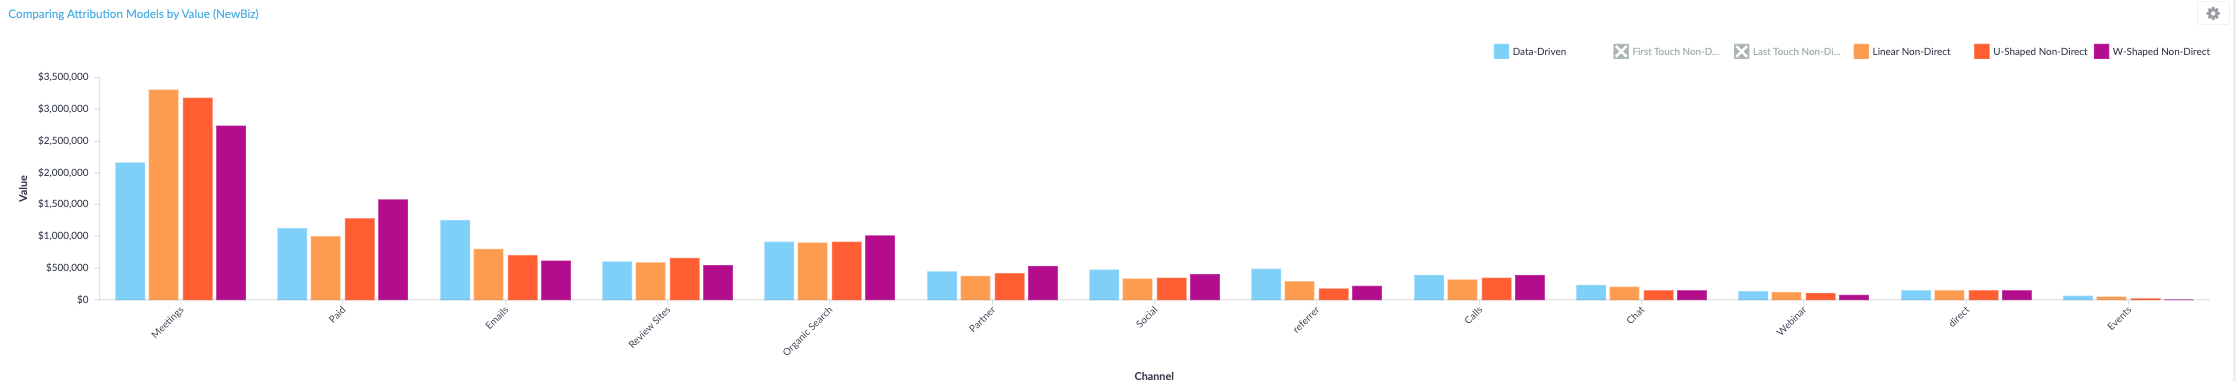
In this graph, we list all the Channels and the respective Value generated by them. Attribution Models provide an indication of which channels have the greatest contribution to Value generation. Remember to adjust the Stage filter according to the purpose of your analysis.
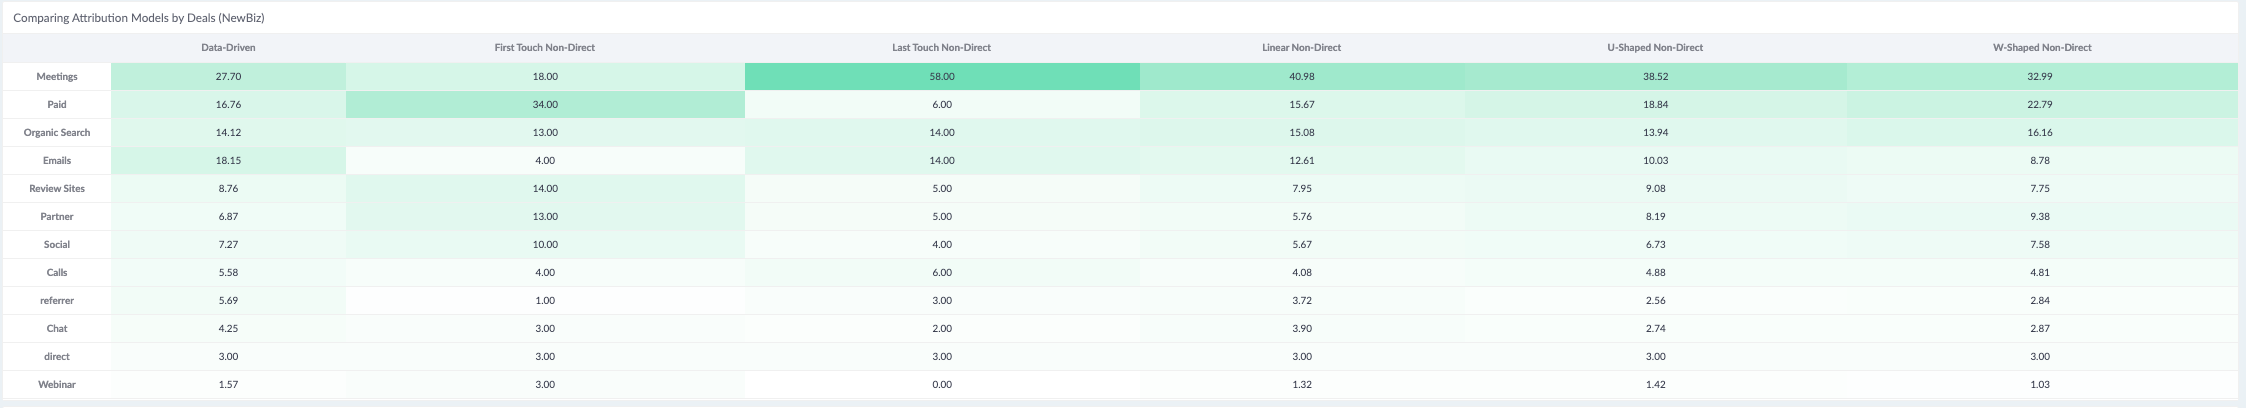
Comparing Attribution Model by Deals
In this table, we compare different Attribution Models, with the purpose of seeing how Deals are being weighed differently, over each Channel. Green colour provides an indication of which channels have the greatest contribution to Deals generation. Remember to adjust the Stage filter according to the purpose of your analysis.
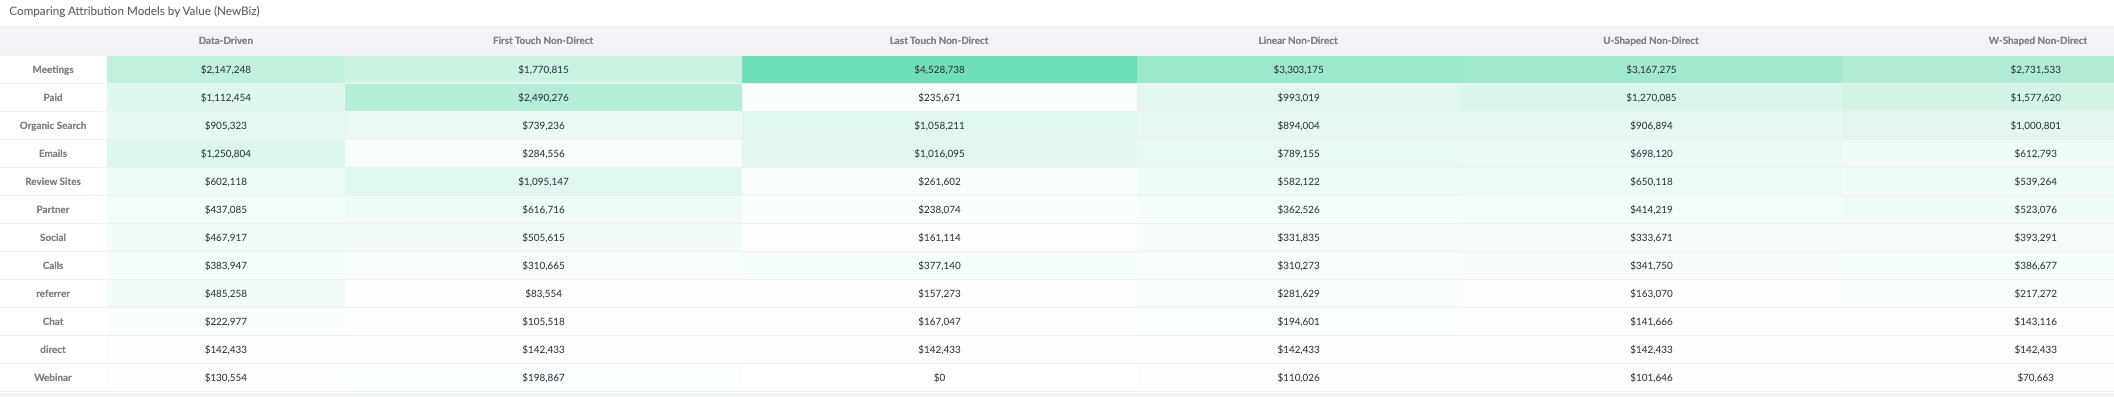
Comparing Attribution Models by Value
In this table, we compare different Attribution Models, with the purpose of seeing how Value is being weighed differently, over each Channel. Green colour provides an indication of which channels have the greatest contribution to Value generation. Remember to adjust the Stage filter according to the purpose of your analysis.