Which channel performs best for different content?
 Updated
by
Mikkel Settnes
Updated
by
Mikkel Settnes
How to use Dreamdata to measure content performance across entry channels
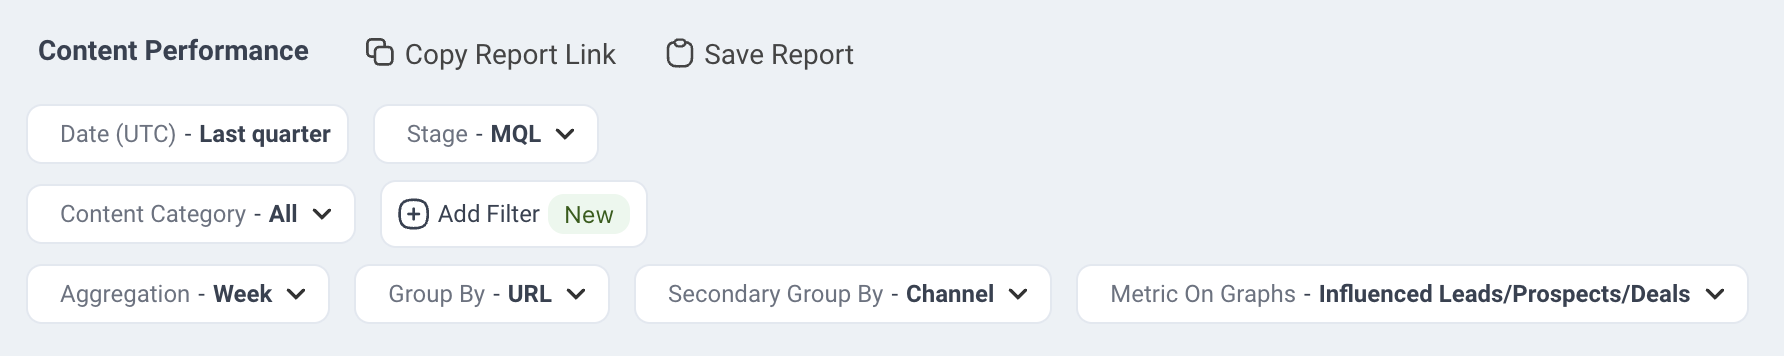
To analyse how people arrive at the content (in terms of channel) and how that affects the content performance towards the MQL pipeline stage, we set the dashboard options as shown.
This will setup the report to investigate:
- Does content perform differently depending on the channel?
- Which content and channel influence the most pipeline?
- Which content and channel performs most effectively in terms of affecting the pipeline?
We choose the Secondary Group By to Session Channel to split the URLs depending on the channel of the session that contains the content view.
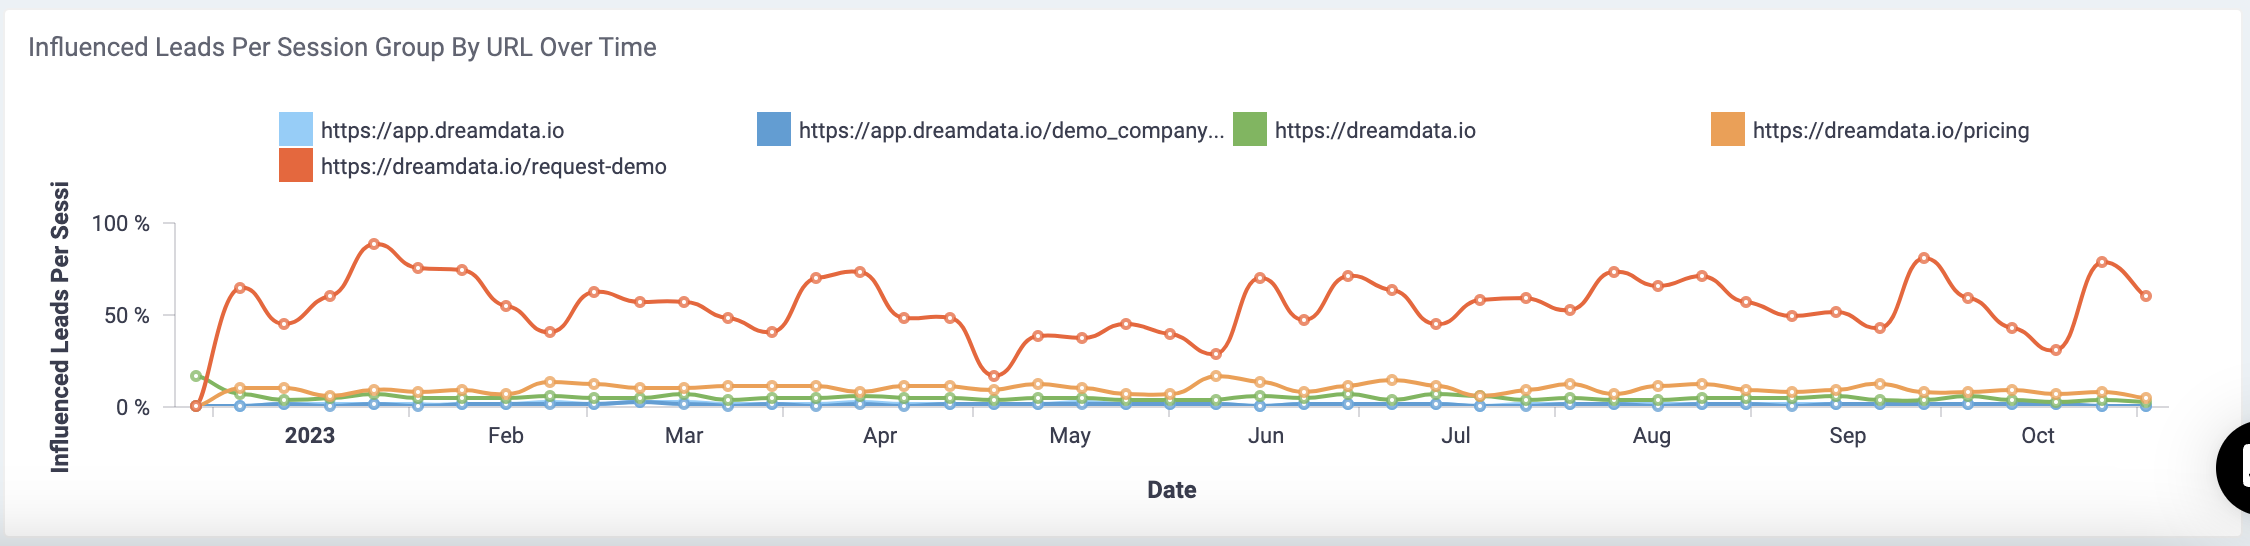
The first graph shows how the number of Influenced Leads evolves over time (to change the metric of this graph use the Metric On Graph option at the top of the page)
The second graph will still show the top URL based on the Metric on Graph option (here we selected - Influenced Leads/Prospects/Deals), but it is also split by the channel of the session containing the content.
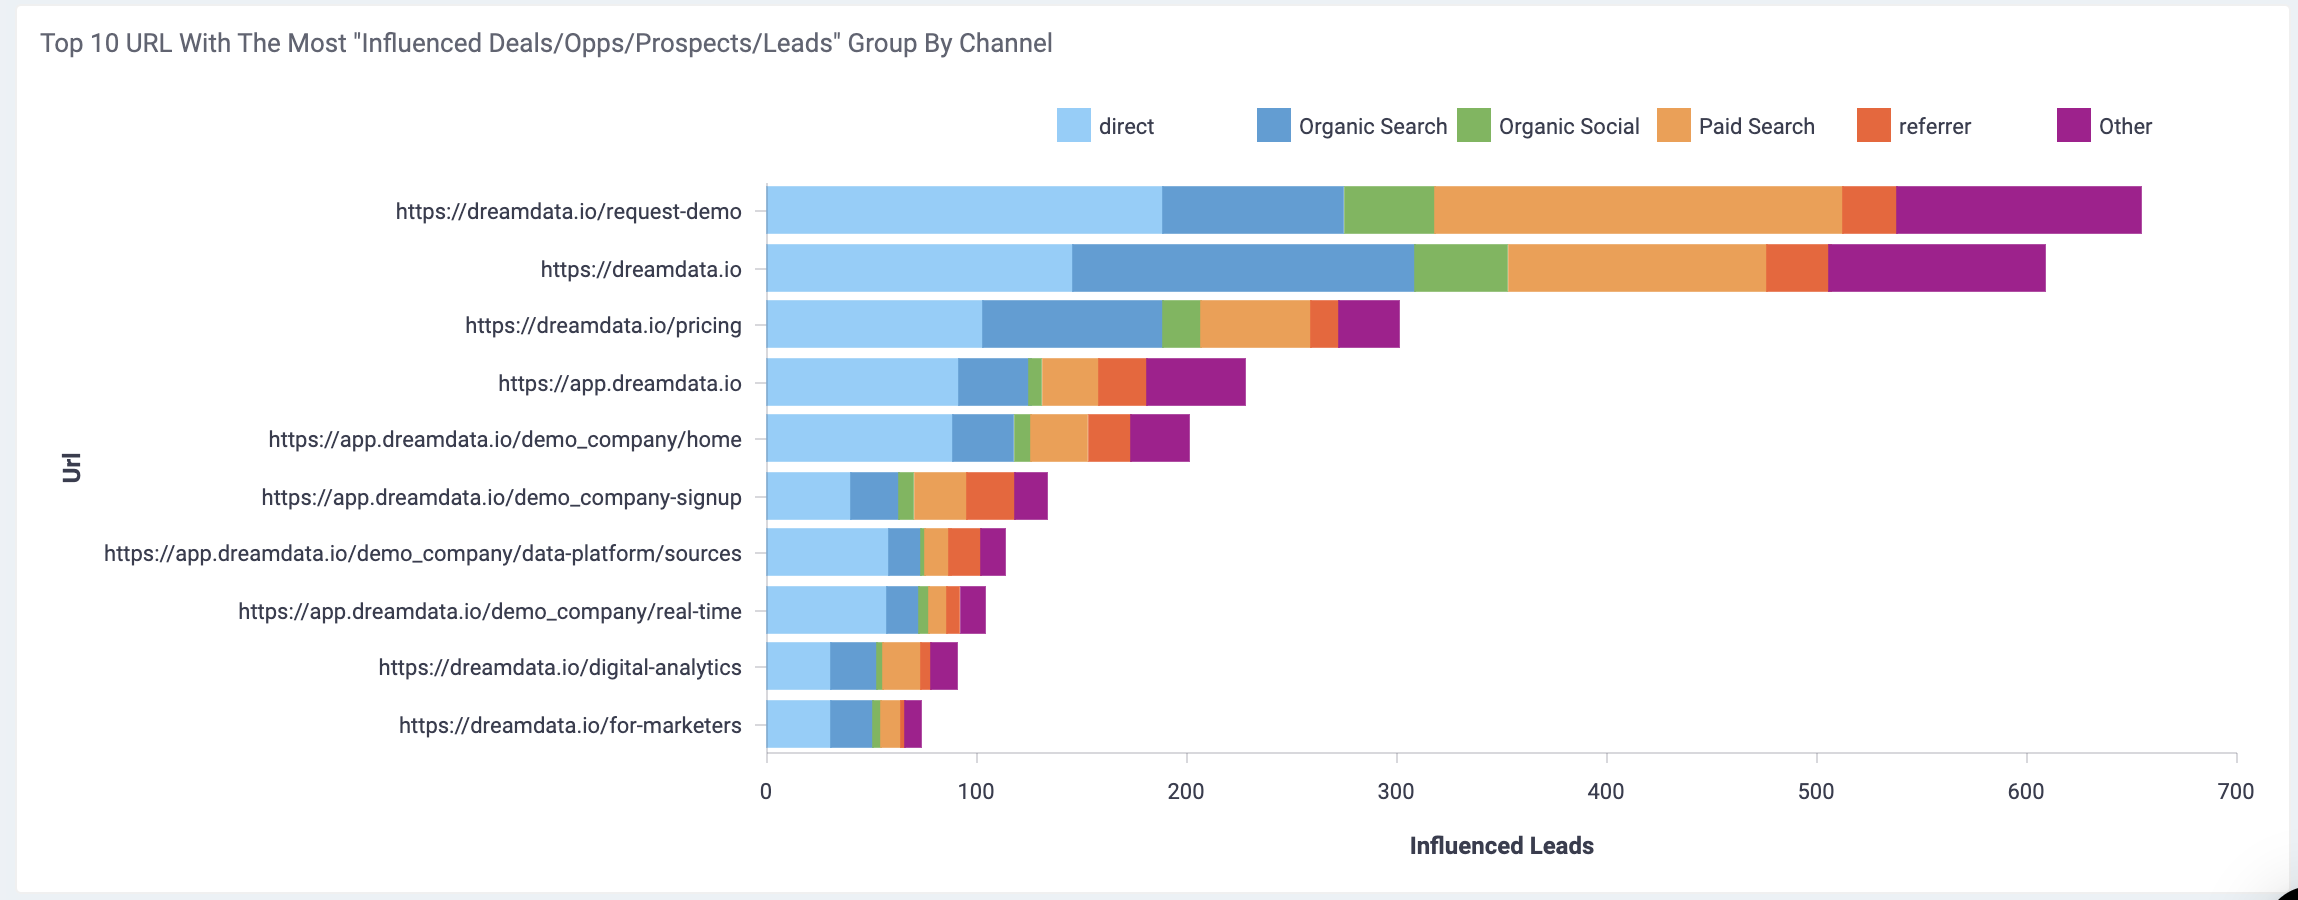
Use this graph to quickly get an overview of the top content and how it splits by channel.
The Summary Table contains the detailed performance of each content piece. Notice that the secondary group by column (Channel) now indicates the session channel and that each content piece therefore will appear for each channel.
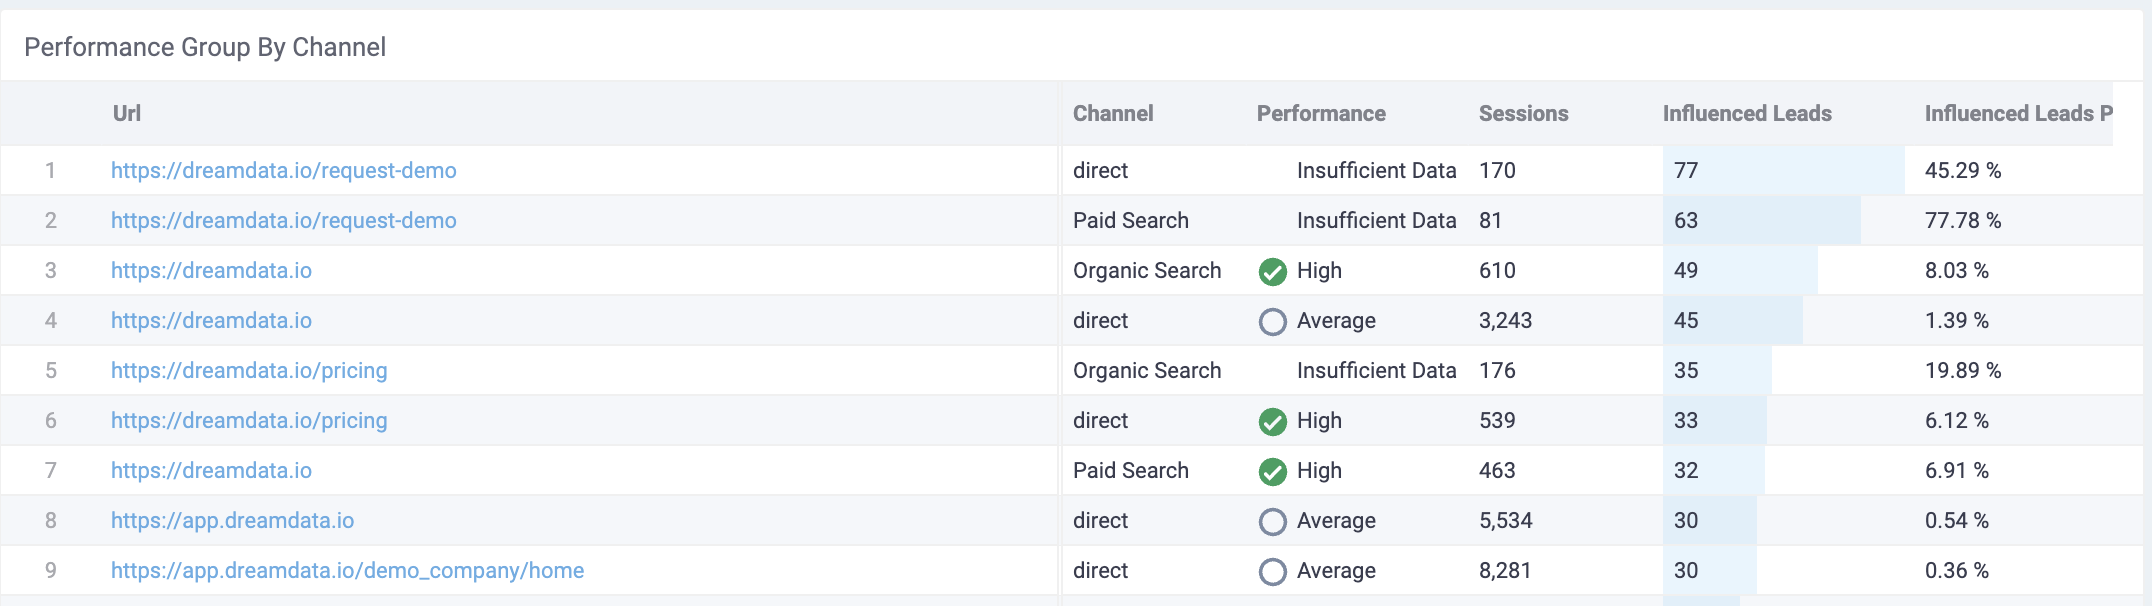
The performance metrics shown follow the same definitions as explained here, with the addition that metrics are calculated for each channel that started a session containing the specified content.
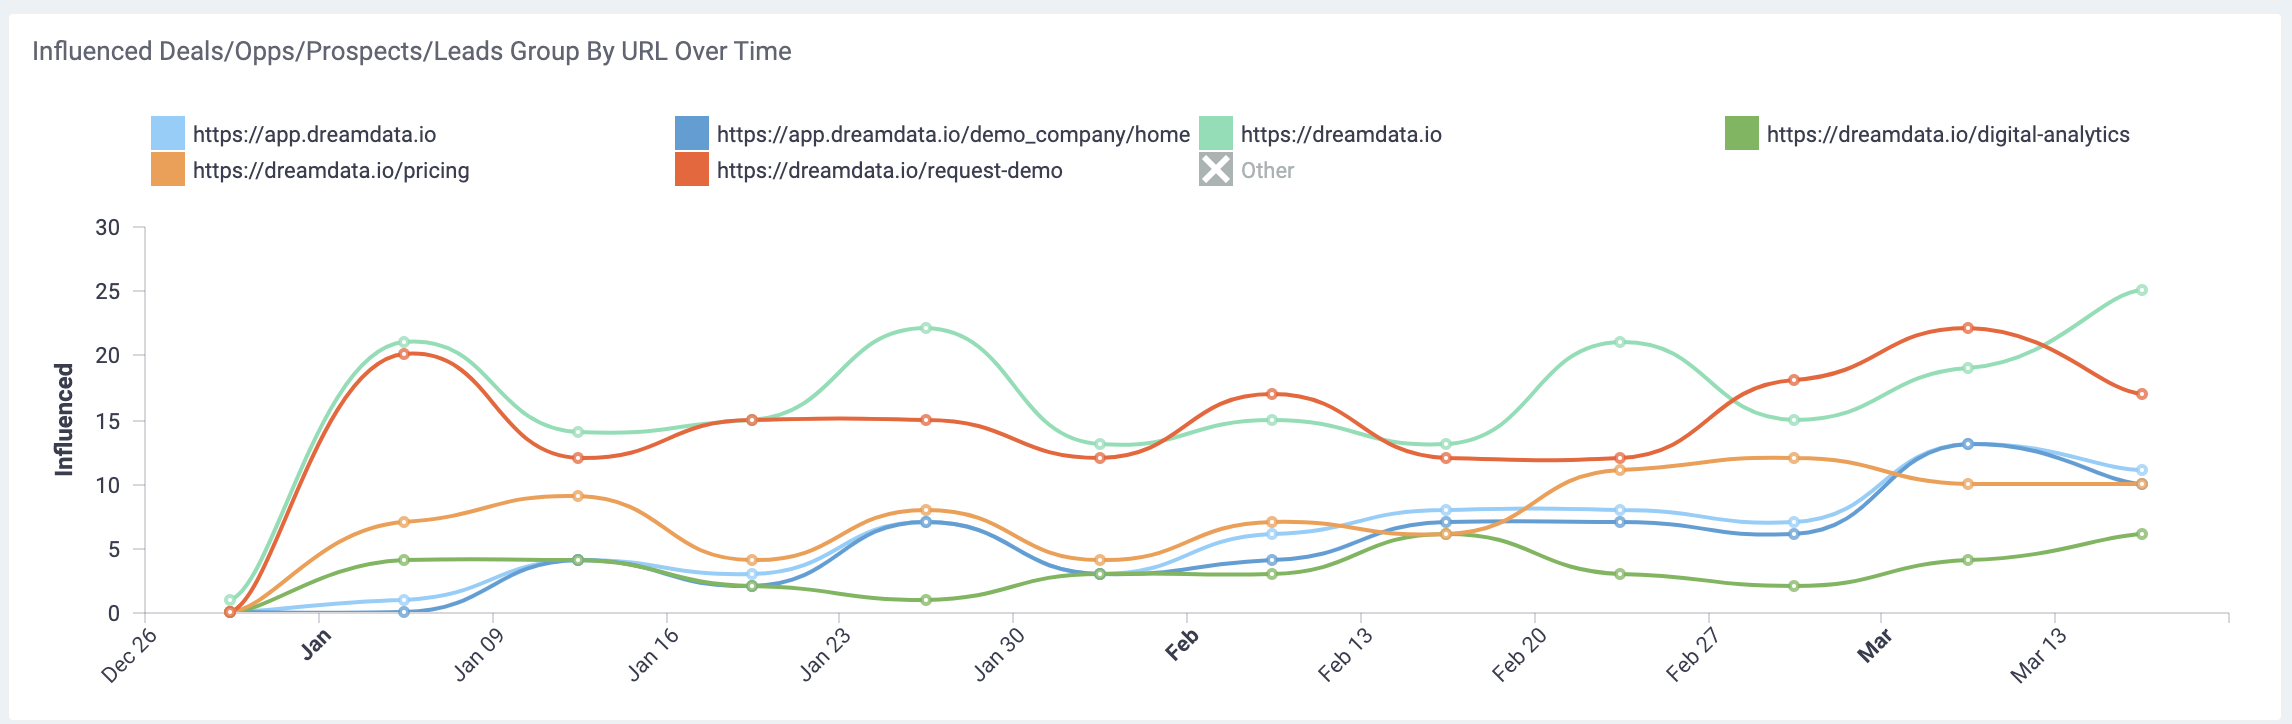
The other over-time view is split by session channel, thereby allowing us to investigate the performance over time of which channels started the sessions that influenced leads.