Get started with Dreamdata
What is Dreamdata? [VIDEO]
Setting Up Dreamdata
How to set up Dreamdata Web tracking (analytics.js) manually
How to set up up Dreamdata web tracking (analytics.js) using Google Tag Manager
How to track forms adding the auto-identify script via Google Tag Manager.
The Onboarding Process
Onboarding process for free customers [VIDEO]
Onboarding for paying customers [VIDEO]
Single sign-on
How to invite your colleagues to Dreamdata
Dashboards
Home
Engagement
Performance
Content Performance
Analytics
Which channel performs best for different content?
Which content influenced the MQLs created in a time period?
Content Performance - Dashboard Options
Which content generates pipeline?
Measuring influenced pipeline for B2B content - the true conversion metric
What KPI to measure the effect of B2B content?
Setup Content Reporting
Content Analytics - Dashboard Options
Paid
Overview
Ad Spend
Return on Ads Spend
Google Search Ads
Google Display Ads
LinkedIn Ads
Bing Ads
Facebook Ads
YouTube Ads
Capterra Ads
G2 Crowd
Organic
Acquisition
Conversions
Web Traffic
Performance vs. Revenue attribution: A guide on when to use what
Journeys
Revenue Analytics
Data Platform
Sources
Intent Data
Paid
Setting up Facebook Ads
Setting up AdRoll
Setting up Twitter Ads
Setting up Bing Ads
Setting up LinkedIn Ads
Setting up Google Ads
Setting up G2
Setting up Capterra
CRM
Marketing Automation
Import Other
Import fixed cost data using Google Sheet
Importing data not in your CRM (using Google Sheets)
Import cost data using Google Sheet
Custom data
Setting up Outreach
Setting up Zapier integration & Zaps for Lead Ads
Setting up Google Search
Setting up Intercom
Destinations
Ad Network
Data Warehouse
Google BigQuery
Connect to AWS Redshift using AWS Glue
Connect your Dreamdata data to Snowflake
Connect your Dreamdata data to Amazon Redshift
Cloud Storage
Business Intelligence
Guides for Looker Studio Reporting
Getting Started with Looker Studio Templates
Google Connected Sheets
Setting up Data Export to BigQuery of CRM Properties
Overview
Company Data Enrichment
Table Schema
Intent data
General Settings
Tracking
Segment
Dreamdata Cookies
Form Tracking
Reduce impact from ad-blockers and Apple ITP 2.x
Pardot iframe form tracking
Anonymizing IP
Tracking using Sleeknote or Drift
How to track your emails?
Cookie Bar
How does Dreamdata track all relevant on-site customer data?
Cookie Retention
Tracking Hubspot Forms with auto-identify script
Server Side Analytics APIs
URL query parameters
Calendly
Tracking iframes with auto-identify script
Tracking SPAs (Single Page Applications)
Across domain & device tracking
Advanced Identification of users and companies
Stage Models
Setup Guide: All Salesforce Opportunities entering specific Stage
Setup Guide: Creation of Opportunities/Deals
Setup Guide: Tracked sign-up events
Setup Guide: All Hubspot Deals entering specific Stage
Stage Models - Customization
Menu: Settings
Allowed Domains
UTM Mapping
Branded Search filter
CRM-Based Channel and Source in the Absence of Tracking Activity
CRM filters
FAQ
Glossary
Categories
Some of my deals are flagged with "Unknown". What does it mean?
Data retention
Can I exclude content or websites from being tracked?
How are activity mapped to companies?
What does Visitors, Contacts and Companies mean?
What is a session?
Roles and Permissions
What is the reporting Time Zone?
Why are my dashboards empty?
Agency Partners
Welcome Partner!
Partner Tiers
Referral Guide and UTM tracking
Partner Material
Intro Template for your new clients
Ideal Customer Profile
Co-marketing and account mapping
Contact
Quick learning videos!
Find the content that generates most pipeline
How to set up content categories on Dreamdata
Do you know how your company is generating money?
How to see the value of B2B Google Ads in pipeline and revenue generated
How Content Analytics tracks the influence of content of pipeline and revenue
How to easily build a retargeting audience with Dreamdata
Are you using G2?
Performance vs. Revenue Analytics reports- when to apply them best!
What attribution really is and why you should care!
Helping BDRs break through to the hottest accounts
Dreamdata Content Analytics: Discover the real value of your content
Do you know which of your Marketing activities had the biggest impact on pipeline and revenue?
Which of your emails produce pipeline and revenue?
See the value of SEO in pipeline and revenue generated
How to cut the cost of your Google Search Ads
- All Categories
- Dashboards
- Revenue Analytics
- Customer Acquisition Cost (CAC) report
Customer Acquisition Cost (CAC) report
Updated
by Andreea Oprea
CAC, or customer acquisition cost, tells you the average total cost of acquiring a customer and it can be used to optimise your marketing efforts helping you identify what to scale, optimise or scrap altogether.
Using the data uploaded through the Import CAC data functionality (details for the setup can be found here) together with any cost data obtained through the existing integrations, we will build a customer acquisition cost report which can be found under the Revenue Analytics section. Uploaded data can contain information about fixed costs such as salaries, commissions, tools, licences, etc and it will help in providing a more accurate report with cost data coming from multiple sources. The report is also available if no extra fixed cost data is shared and it covers the last 8 quarters.
To read more about why we think a CAC report is valuable check out this blog post about customer acquisition cost.
We will allow you to look at your CAC values for any 3 stages you already setup with Dreamdata. The default aggregation level available is monthly but we also offer a quarterly view. In the report you can find a few different views:
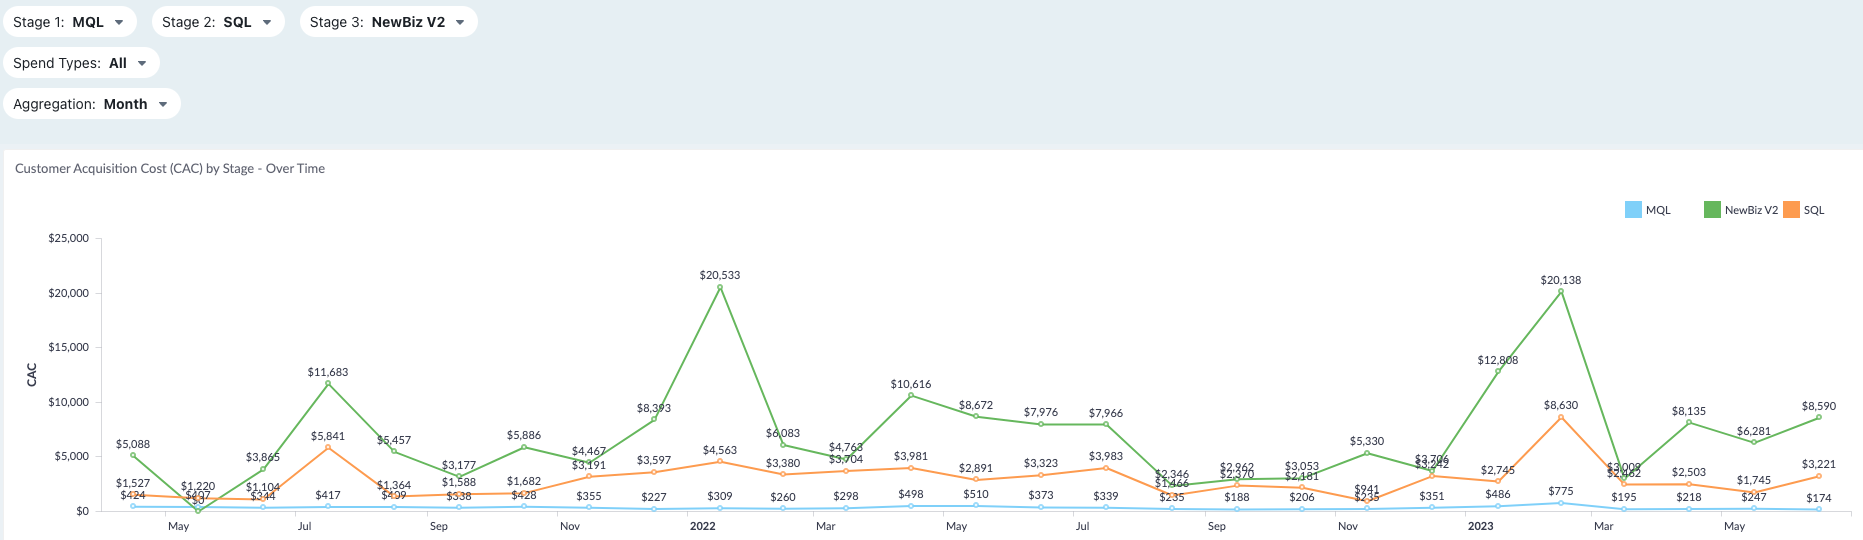
1. Customer acquisition cost over time plot
If you have selected Marketing Qualified Leads (MQL), Sales Qualified Leads (SQL), and NewBiz as your 3 stages in Dreamdata, this plot would tell you how much you spent to acquire an MQL, SQL or a NewBiz customer.
The plot provides an overview of the 3 selected stages and the CAC value for each by month or quarter, depending on the aggregation level selected.
Formula:
CAC = Total cost (salaries and tech subscriptions as well as paid campaign costs)/ Number of customers.
Example:

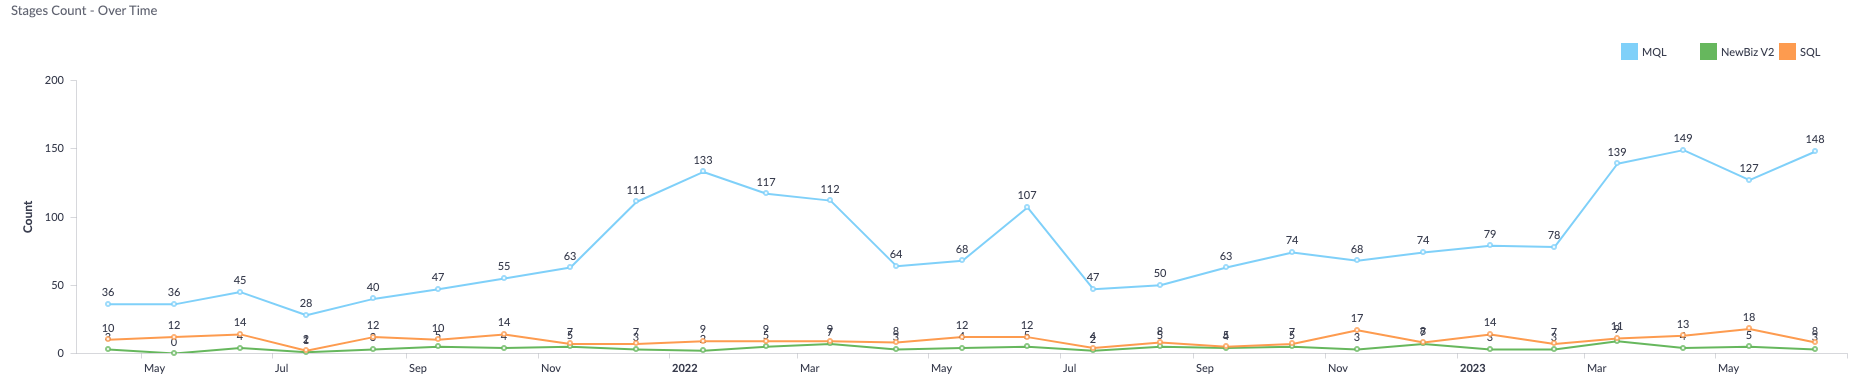
2. Count over time by stage plot
Overview of the monthly or quarterly number of leads/clients reaching each stage. You can read more about the stage models setup here.
Example:

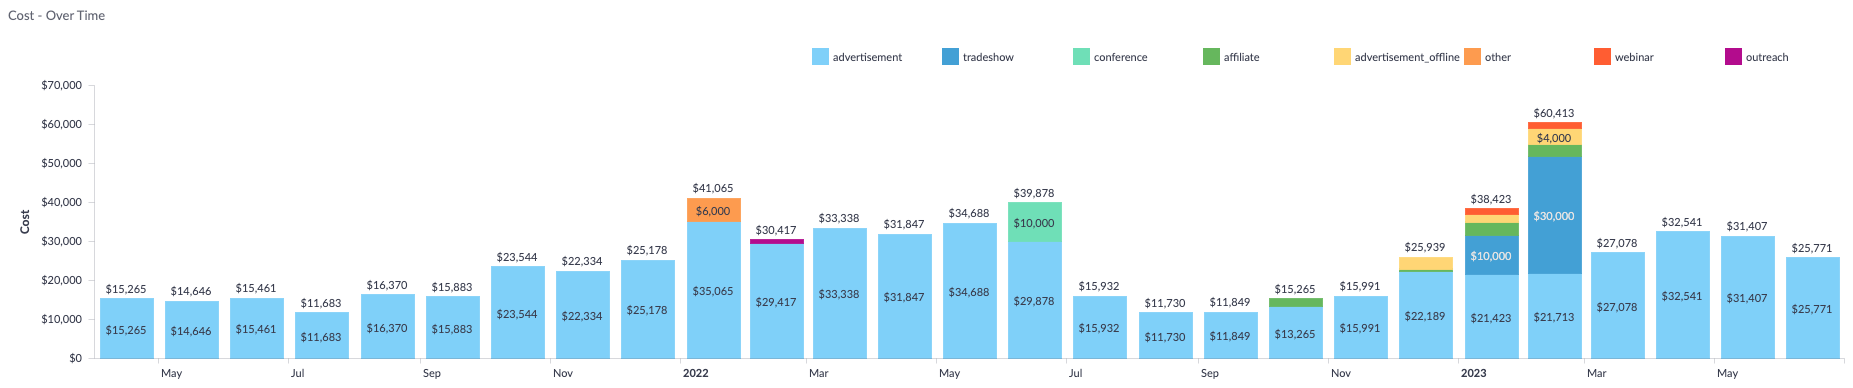
3. Cost over time by type plot
Monthly or quarterly overview of the total cost (all cost coming from the connected sources combined with data from the manual upload, if any was provided) grouped by type. The available types are coming from the sources or from the imported data.
Example:

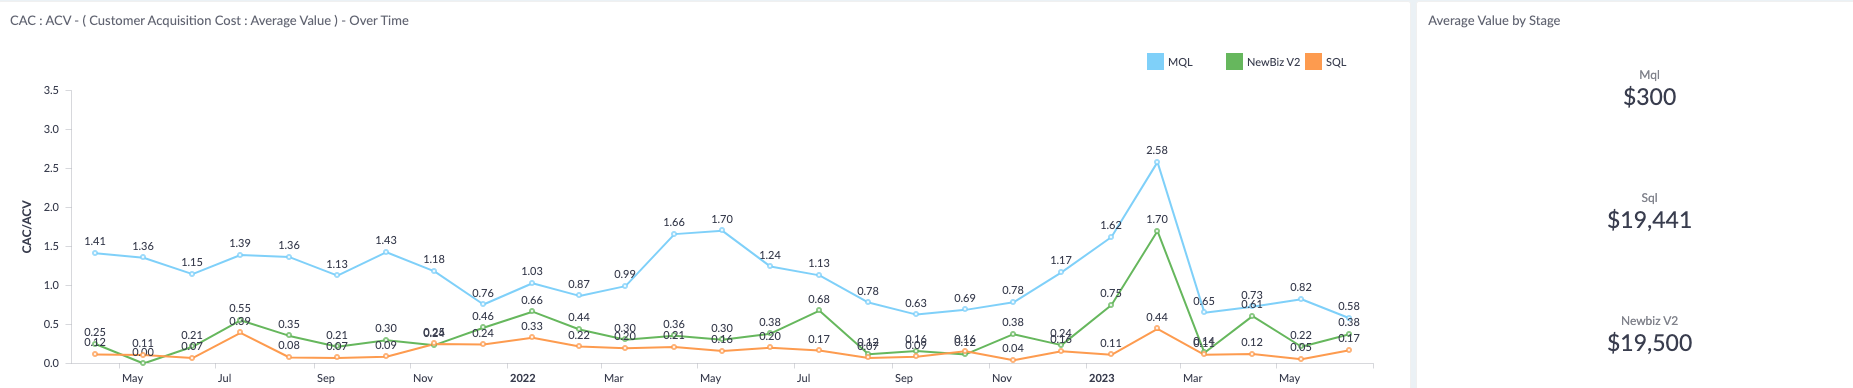
4. Customer Acquisition cost / Average value plot
The CAC/ACV value for each of the 3 selected stages, which represents the customer acquisition cost divided by the average value by stage, can be seen in this plot. The average value for each stage is also visible, which can be manually added in the stage models for earlier stages or calculated for stages further in the journey.
A lower ratio is usually desired as it indicates a lower customer acquisition cost or higher average value by stage. This view can also show that a higher CAC is not necessarily an issue if the average value for each customer becomes higher in time.
Example:

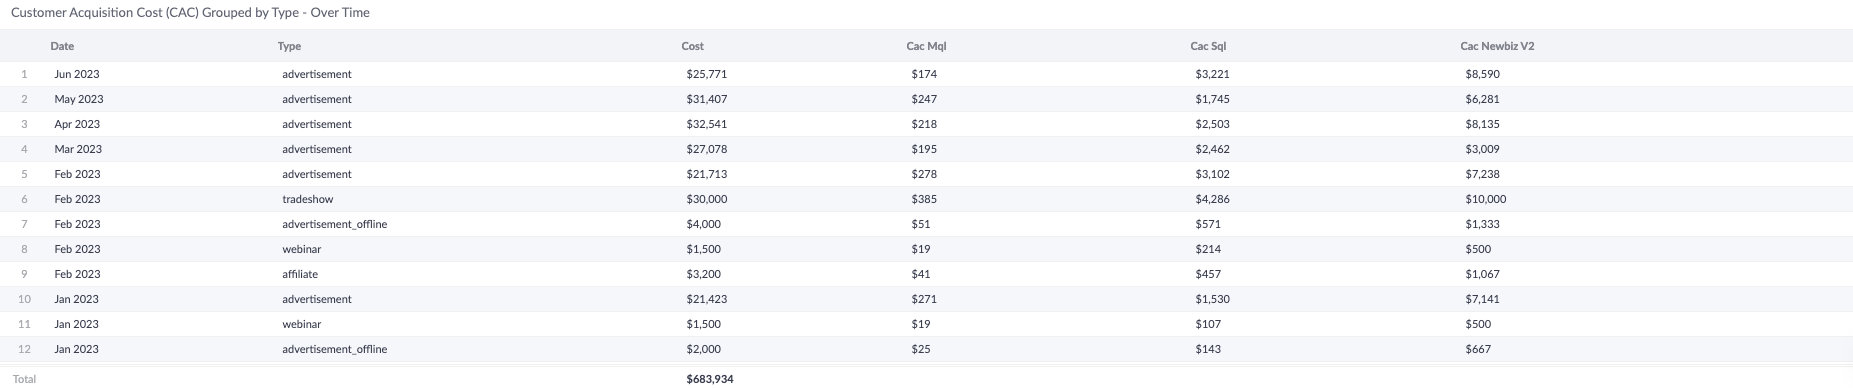
5. Customer acquisition cost table
A view of some of the values previously presented in the above mentioned plots combining cost and CAC values for each month or quarter, by type.
Example:

All plots and tables can be downloaded in different formats (such as CSV, Excel, PDF or image)