Get started with Dreamdata
What is Dreamdata? [VIDEO]
Setting Up Dreamdata
How to set up Dreamdata Web tracking (analytics.js) manually
How to set up up Dreamdata web tracking (analytics.js) using Google Tag Manager
How to track forms adding the auto-identify script via Google Tag Manager.
The Onboarding Process
Onboarding process for free customers [VIDEO]
Onboarding for paying customers [VIDEO]
Single sign-on
How to invite your colleagues to Dreamdata
How to validate your data
Dashboards
Home
Engagement
Performance
Content Performance
Setup Content Reporting
Content Performance - Dashboard Options
What KPI should you use to measure the effect of B2B content?
Measuring influenced pipeline for B2B content - the true conversion metric
What content generates pipeline?
Which channel performs best for different content?
Paid
Overview
Return on Ads Spend (ROAS)
Google Search Ads
Google Display Ads
LinkedIn Ads
Bing Ads
Facebook Ads
YouTube Ads
Capterra Ads
G2 Crowd
Organic
Acquisition
ROI
Performance vs. Revenue attribution: A guide on when to use what
Journeys
Revenue Analytics
Data Platform
Sources
Intent Data
Albacross
Snitcher
6sense
RollWorks
Dealfront Leadfeeder
ZoomInfo WebSights
Clearbit
Triblio ABM platform
Paid
Setting up Facebook Ads
Setting up AdRoll
Setting up Twitter Ads
Setting up Bing Ads
Setting up LinkedIn Ads
Setting up Google Ads
Setting up G2
Setting up Capterra
CRM
Marketing Automation
Import Other
Import fixed cost data using Google Sheet
Import Events data using Google Sheet
Import cost data using Google Sheet
Custom data
Setting up Outreach
Setting up Zapier integration & Zaps for Lead Ads
Setting up Google Search
Setting up Intercom
Destinations
Ad Network
LinkedIn Offline Conversion (CAPI)
Google Ads Offline Conversion
Google Ads Offline Conversion: Salesforce vs Dreamdata
Google Ads Offline Conversion: Hubspot vs Dreamdata
Data Warehouse
Google BigQuery
Connect to AWS Redshift using AWS Glue
Connect your Dreamdata data to Snowflake
Connect your Dreamdata data to Amazon Redshift
Cloud Storage
Business Intelligence
Guides for Looker Studio Reporting
Getting Started with Looker Studio Templates
Google Connected Sheets
Setting up Data Export to BigQuery of CRM Properties
Overview
Company Data Enrichment
Table Schema
Intent data
General Settings
Tracking
Segment
Dreamdata Cookies
Form Tracking
Reduce impact from ad-blockers and Apple ITP 2.x
Pardot iframe form tracking
Anonymizing IP
Tracking using Sleeknote or Drift
How to track your emails?
Cookie Bar
How does Dreamdata track all relevant on-site customer data?
Cookie Retention
Tracking Hubspot Forms with auto-identify script
Server Side Analytics APIs
URL query parameters
Calendly
Tracking iframes with auto-identify script
Intercom Tracking
Tracking SPAs (Single Page Applications)
Across domain & device tracking
Advanced Identification of users and companies
Tracking Dynamics 365 Marketing Forms
Attribution Models
Stage Models
Setup Guide: All Salesforce Opportunities entering specific Stage
Setup Guide: All Microsoft Dynamics Opportunities in a specific Stage
Setup Guide: All Pipedrive Deals entering specific Stage
Setup Guide: Creation of Opportunities/Deals
Setup Guide: Tracked sign-up events
How Dreamdata Handles Currency Exchange in Stage Models
Setup Guide: All Hubspot Deals entering specific Stage
Stage Models - Customization
Menu: Settings
Allowed Domains
UTM Mapping
Learn more about the 'Branded Search' filter
CRM-Based Channel and Source in the Absence of Tracking Activity
CRM filters
FAQ
Glossary
Conversions
What is a company?
Some of my deals are flagged with "Unknown". What does it mean?
Data retention and deletion
How is anonymous traffic linked to companies?
Can I exclude content or websites from being tracked?
Influenced vs Attributed Leads and Value
Understanding the Difference: Conversions vs. Stages
What does Visitors, Contacts and Companies mean?
What is a session?
Roles and Permissions
What is the reporting Time Zone?
Why are my dashboards empty?
Agency Partners
Welcome Partner!
Partner Tiers
Referral Guide and UTM tracking
Partner Material
Intro Template for your new clients
Ideal Customer Profile
Co-marketing and account mapping
Contact
Quick learning videos!
Find the content that generates most pipeline
How to set up content categories on Dreamdata
Do you know how your company is generating money?
How to see the value of B2B Google Ads in pipeline and revenue generated
How Content Analytics tracks the influence of content of pipeline and revenue
How to easily build a retargeting audience with Dreamdata
Are you using G2?
Performance vs. Revenue Analytics reports- when to apply them best!
What attribution really is and why you should care!
Helping BDRs break through to the hottest accounts
Dreamdata Content Analytics: Discover the real value of your content
Do you know which of your Marketing activities had the biggest impact on pipeline and revenue?
Which of your emails produce pipeline and revenue?
See the value of SEO in pipeline and revenue generated
How to cut the cost of your Google Search Ads
Search
Updated
by Siminta Jacinavice

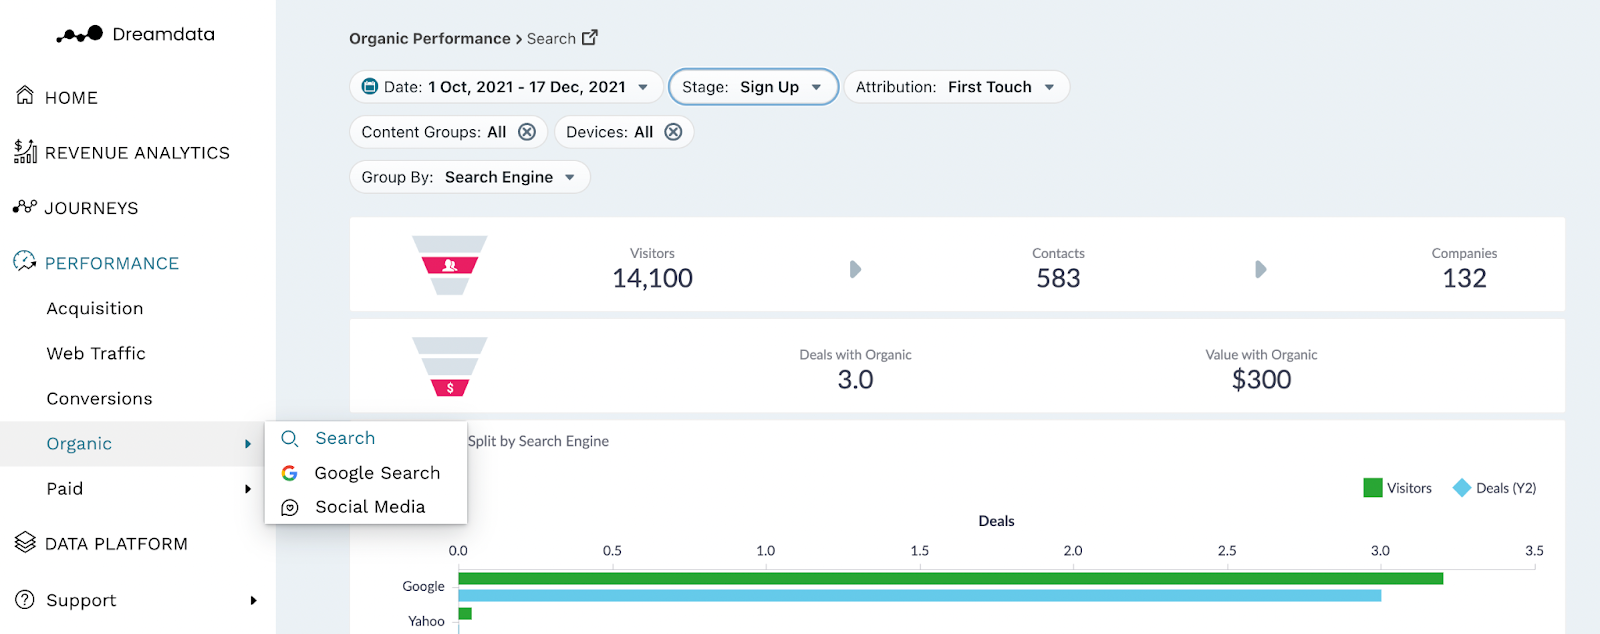
With this dashboard, we provide an overview of your Organic Search performance, especially in terms of revenue generation. This feature is helpful when understanding online behaviour of your website visitors.
Filters

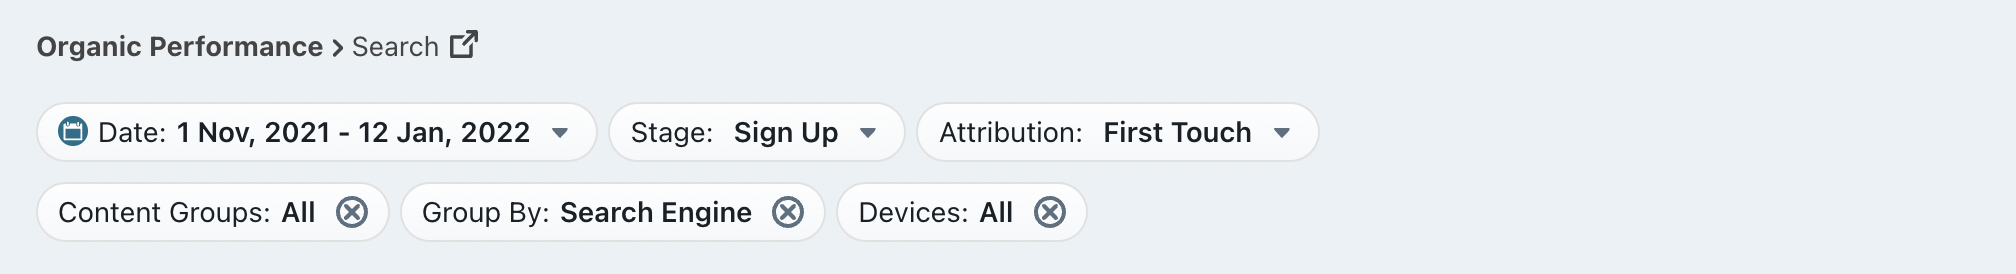
Date: Set the time period you want to investigate
Stage: You can select your preferred pipeline stage. Read more about the Free Tier Stages here
Attribution: Choose the attribution model which is meaningful for your analysis
- First Touch
- Last Touch
- Linear
- U-Shaped
- W-Shaped
Content Groups: Choose the content group you want to analyse
Devices: Choose the device to analyse specific traffic
- Desktop
- Mobile
- Tablet
Group By: Choose certain options to see how it affects your deals
- Search Engine
- Page
- Content
- Country
- Device
- Search Engine + Page
Note: Date is referring to the time period when the searches were completed
Metrics
Visitors: The number of visitors who have come to your website via organic search
Contacts: The number of visitors who we have been able to attach an email to their user id
Companies: The number of companies who are attached to Contacts, or the number of companies in your CRM who can be attached to any visitor traffic (anonymous)
Deals with Organic: The number of deals that are associated with Organic Search based on your selected filters
Value with Organic: The amount of revenue that is attributed to the Organic Search based on your selected filters
Funnel Overview

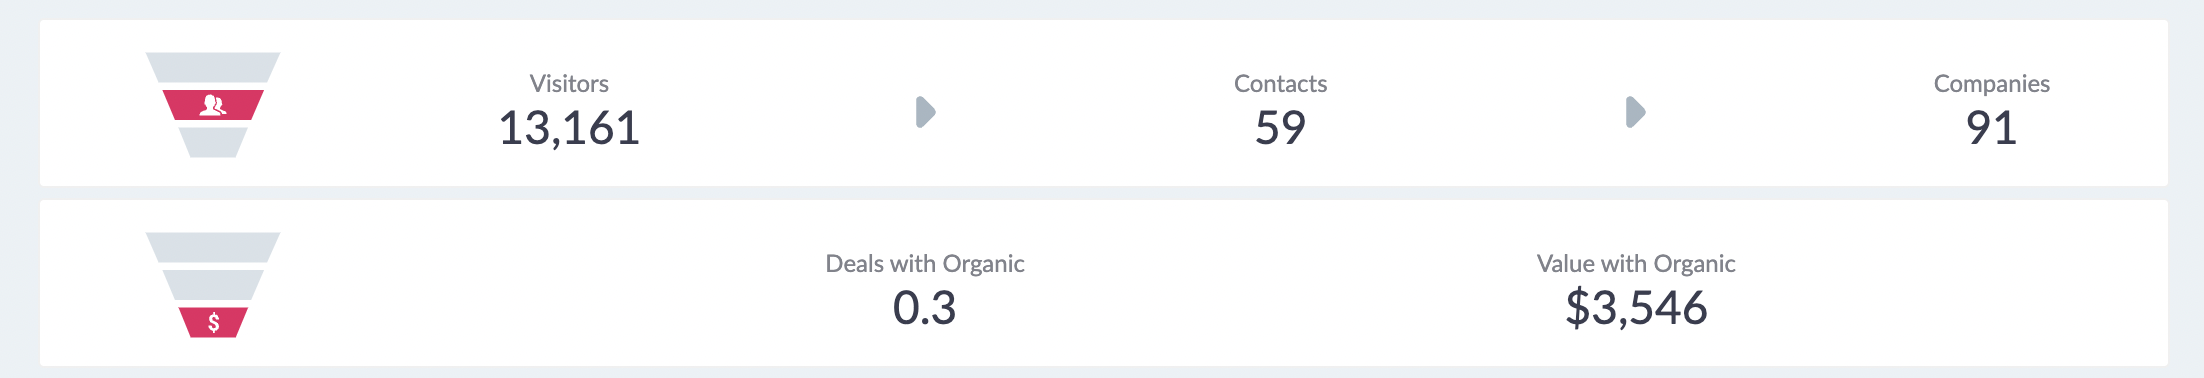
Visitors → Contacts → Companies
In this first section, we give an overview of the organic traffic from different Search Engines which is based on the Tracking script we have on your websites.
Deals with Organic → Value with Organic
In the second section, we provide the total number of Attributable Deals and Attributable Value (revenue) that can be assigned to different Organic Search Engines based on the filters selected.
To calculate these numbers, we first look at the pool of contacts/companies that visited your website through different Organic Search Engines based on the dates/filters. Once we have that group, we see what deals were closed after their visit, up to today's date. More importantly, we are only looking at deals where we have a recorded history of sessions; Attributable Deals. This pool of attributable deals will make up the basis for this section. For each of these deals and all their sessions, we will run the Attribution Model you have selected so each session is weighed respectively.
For both Attributable Deal and Value (revenue), we then provide the sum of these amounts for each session that contains an Organic Search, dependent on which Attribution Model you have selected.
Note: When using First Touch/Last Touch you will get a rounded deal number, as a deal is either First Touch Paid or Not. While with Linear, W-Shaped or U-Shaped you will get a fraction of a deal as most Paid Touchpoints will make up a fraction of the sessions on a deal.
Graphs and Tables
Deals and Values split by Search Engine
We provide a graph showing the organic traffic and attributable deals of each Search Engine over the period of time specified in your Filters. This information can help you understand which Search Engines convert better.
Note: This Graph is used for a quick overview of Visitors over Deals generated via different Search Engines (split by your chosen Group By filter). Change filter to display: content, devices, countries, etc.
Performance by Search Engine

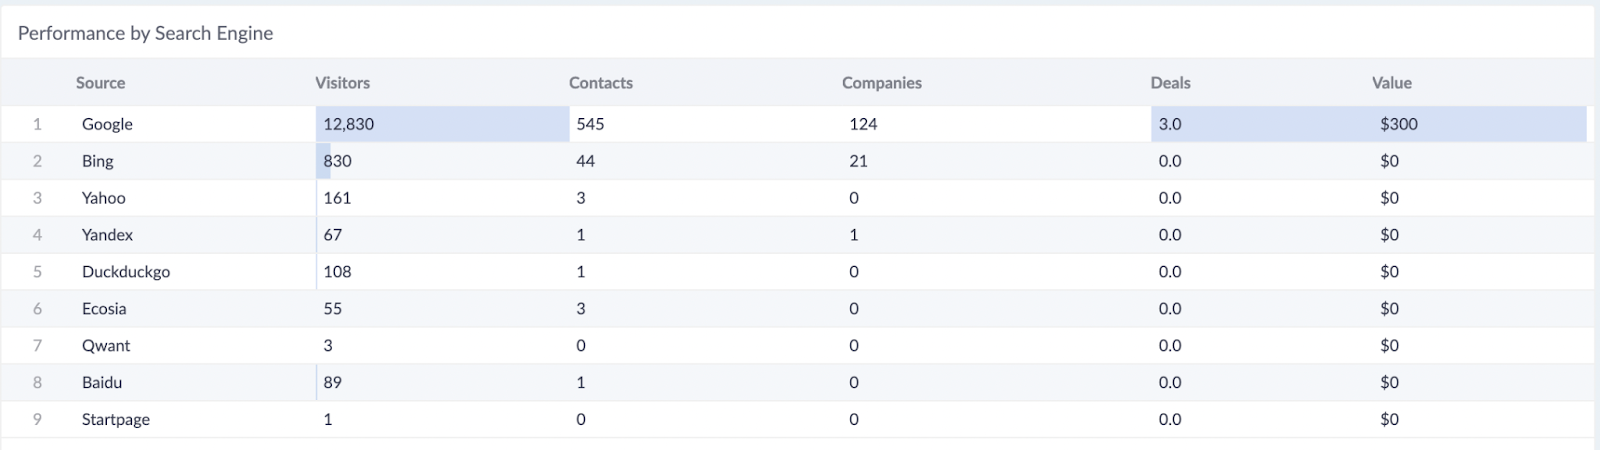
In this table, we list all the Search Engines that were used during the time frame specified. We provide all the metrics for Search Engines making it easier for you to compare and find out which performed and which ones did not.
Performance by Page
This report shows which website pages have been used by Organic Visitors, and which pages bring more value than others.
Performance by Content
This report shows which contents (videos, blog, website, etc.) have been used by Organic Visitors, and which content brings more value than others.
Performance by Device
This report shows which devices have been used by Organic Visitors, and which devices bring more value than others.
Performance by Country
This report shows where your campaign click events happen, and which regions bring more value than others.
Note: You can open a larger view by clicking on the performance title in the top left corner.
Deal Split by Search Engine over Time
We provide a graph showing the attributable organic deals of each Search Engine over the period of time specified in your Filters. This information can help you choose which Search Engines to prioritise.
Note: This Graph is used for a quick overview of your Organic Deals generated via your set Group By filter. Change filter to display: content, devices, countries, etc.