Get started with Dreamdata
What is Dreamdata? [VIDEO]
Setting Up Dreamdata
How to set up Dreamdata Web tracking (analytics.js) manually
How to set up up Dreamdata web tracking (analytics.js) using Google Tag Manager
How to track forms adding the auto-identify script via Google Tag Manager.
The Onboarding Process
Onboarding process for free customers [VIDEO]
Onboarding for paying customers [VIDEO]
Single sign-on
How to invite your colleagues to Dreamdata
Dashboards
Home
Engagement
Performance
Content Performance
Analytics
Which channel performs best for different content?
Which content influenced the MQLs created in a time period?
Content Performance - Dashboard Options
Which content generates pipeline?
Measuring influenced pipeline for B2B content - the true conversion metric
What KPI to measure the effect of B2B content?
Setup Content Reporting
Content Analytics - Dashboard Options
Paid
Overview
Ad Spend
Return on Ads Spend
Google Search Ads
Google Display Ads
LinkedIn Ads
Bing Ads
Facebook Ads
YouTube Ads
Capterra Ads
G2 Crowd
Organic
Acquisition
Conversions
Web Traffic
Performance vs. Revenue attribution: A guide on when to use what
Journeys
Revenue Analytics
Data Platform
Sources
Intent Data
Paid
Setting up Facebook Ads
Setting up AdRoll
Setting up Twitter Ads
Setting up Bing Ads
Setting up LinkedIn Ads
Setting up Google Ads
Setting up G2
Setting up Capterra
CRM
Marketing Automation
Import Other
Import fixed cost data using Google Sheet
Importing data not in your CRM (using Google Sheets)
Import cost data using Google Sheet
Custom data
Setting up Outreach
Setting up Zapier integration & Zaps for Lead Ads
Setting up Google Search
Setting up Intercom
Destinations
Ad Network
Data Warehouse
Google BigQuery
Connect to AWS Redshift using AWS Glue
Connect your Dreamdata data to Snowflake
Connect your Dreamdata data to Amazon Redshift
Cloud Storage
Business Intelligence
Guides for Looker Studio Reporting
Getting Started with Looker Studio Templates
Google Connected Sheets
Setting up Data Export to BigQuery of CRM Properties
Overview
Company Data Enrichment
Table Schema
Intent data
General Settings
Tracking
Segment
Dreamdata Cookies
Form Tracking
Reduce impact from ad-blockers and Apple ITP 2.x
Pardot iframe form tracking
Anonymizing IP
Tracking using Sleeknote or Drift
How to track your emails?
Cookie Bar
How does Dreamdata track all relevant on-site customer data?
Cookie Retention
Tracking Hubspot Forms with auto-identify script
Server Side Analytics APIs
URL query parameters
Calendly
Tracking iframes with auto-identify script
Tracking SPAs (Single Page Applications)
Across domain & device tracking
Advanced Identification of users and companies
Stage Models
Setup Guide: All Salesforce Opportunities entering specific Stage
Setup Guide: Creation of Opportunities/Deals
Setup Guide: Tracked sign-up events
Setup Guide: All Hubspot Deals entering specific Stage
Stage Models - Customization
Menu: Settings
Allowed Domains
UTM Mapping
Branded Search filter
CRM-Based Channel and Source in the Absence of Tracking Activity
CRM filters
FAQ
Glossary
Categories
Some of my deals are flagged with "Unknown". What does it mean?
Data retention
Can I exclude content or websites from being tracked?
How are activity mapped to companies?
What does Visitors, Contacts and Companies mean?
What is a session?
Roles and Permissions
What is the reporting Time Zone?
Why are my dashboards empty?
Agency Partners
Welcome Partner!
Partner Tiers
Referral Guide and UTM tracking
Partner Material
Intro Template for your new clients
Ideal Customer Profile
Co-marketing and account mapping
Contact
Quick learning videos!
Find the content that generates most pipeline
How to set up content categories on Dreamdata
Do you know how your company is generating money?
How to see the value of B2B Google Ads in pipeline and revenue generated
How Content Analytics tracks the influence of content of pipeline and revenue
How to easily build a retargeting audience with Dreamdata
Are you using G2?
Performance vs. Revenue Analytics reports- when to apply them best!
What attribution really is and why you should care!
Helping BDRs break through to the hottest accounts
Dreamdata Content Analytics: Discover the real value of your content
Do you know which of your Marketing activities had the biggest impact on pipeline and revenue?
Which of your emails produce pipeline and revenue?
See the value of SEO in pipeline and revenue generated
How to cut the cost of your Google Search Ads
- All Categories
- Dashboards
- Performance
- Paid
- Overview
Overview
Updated
by Siminta Jacinavice

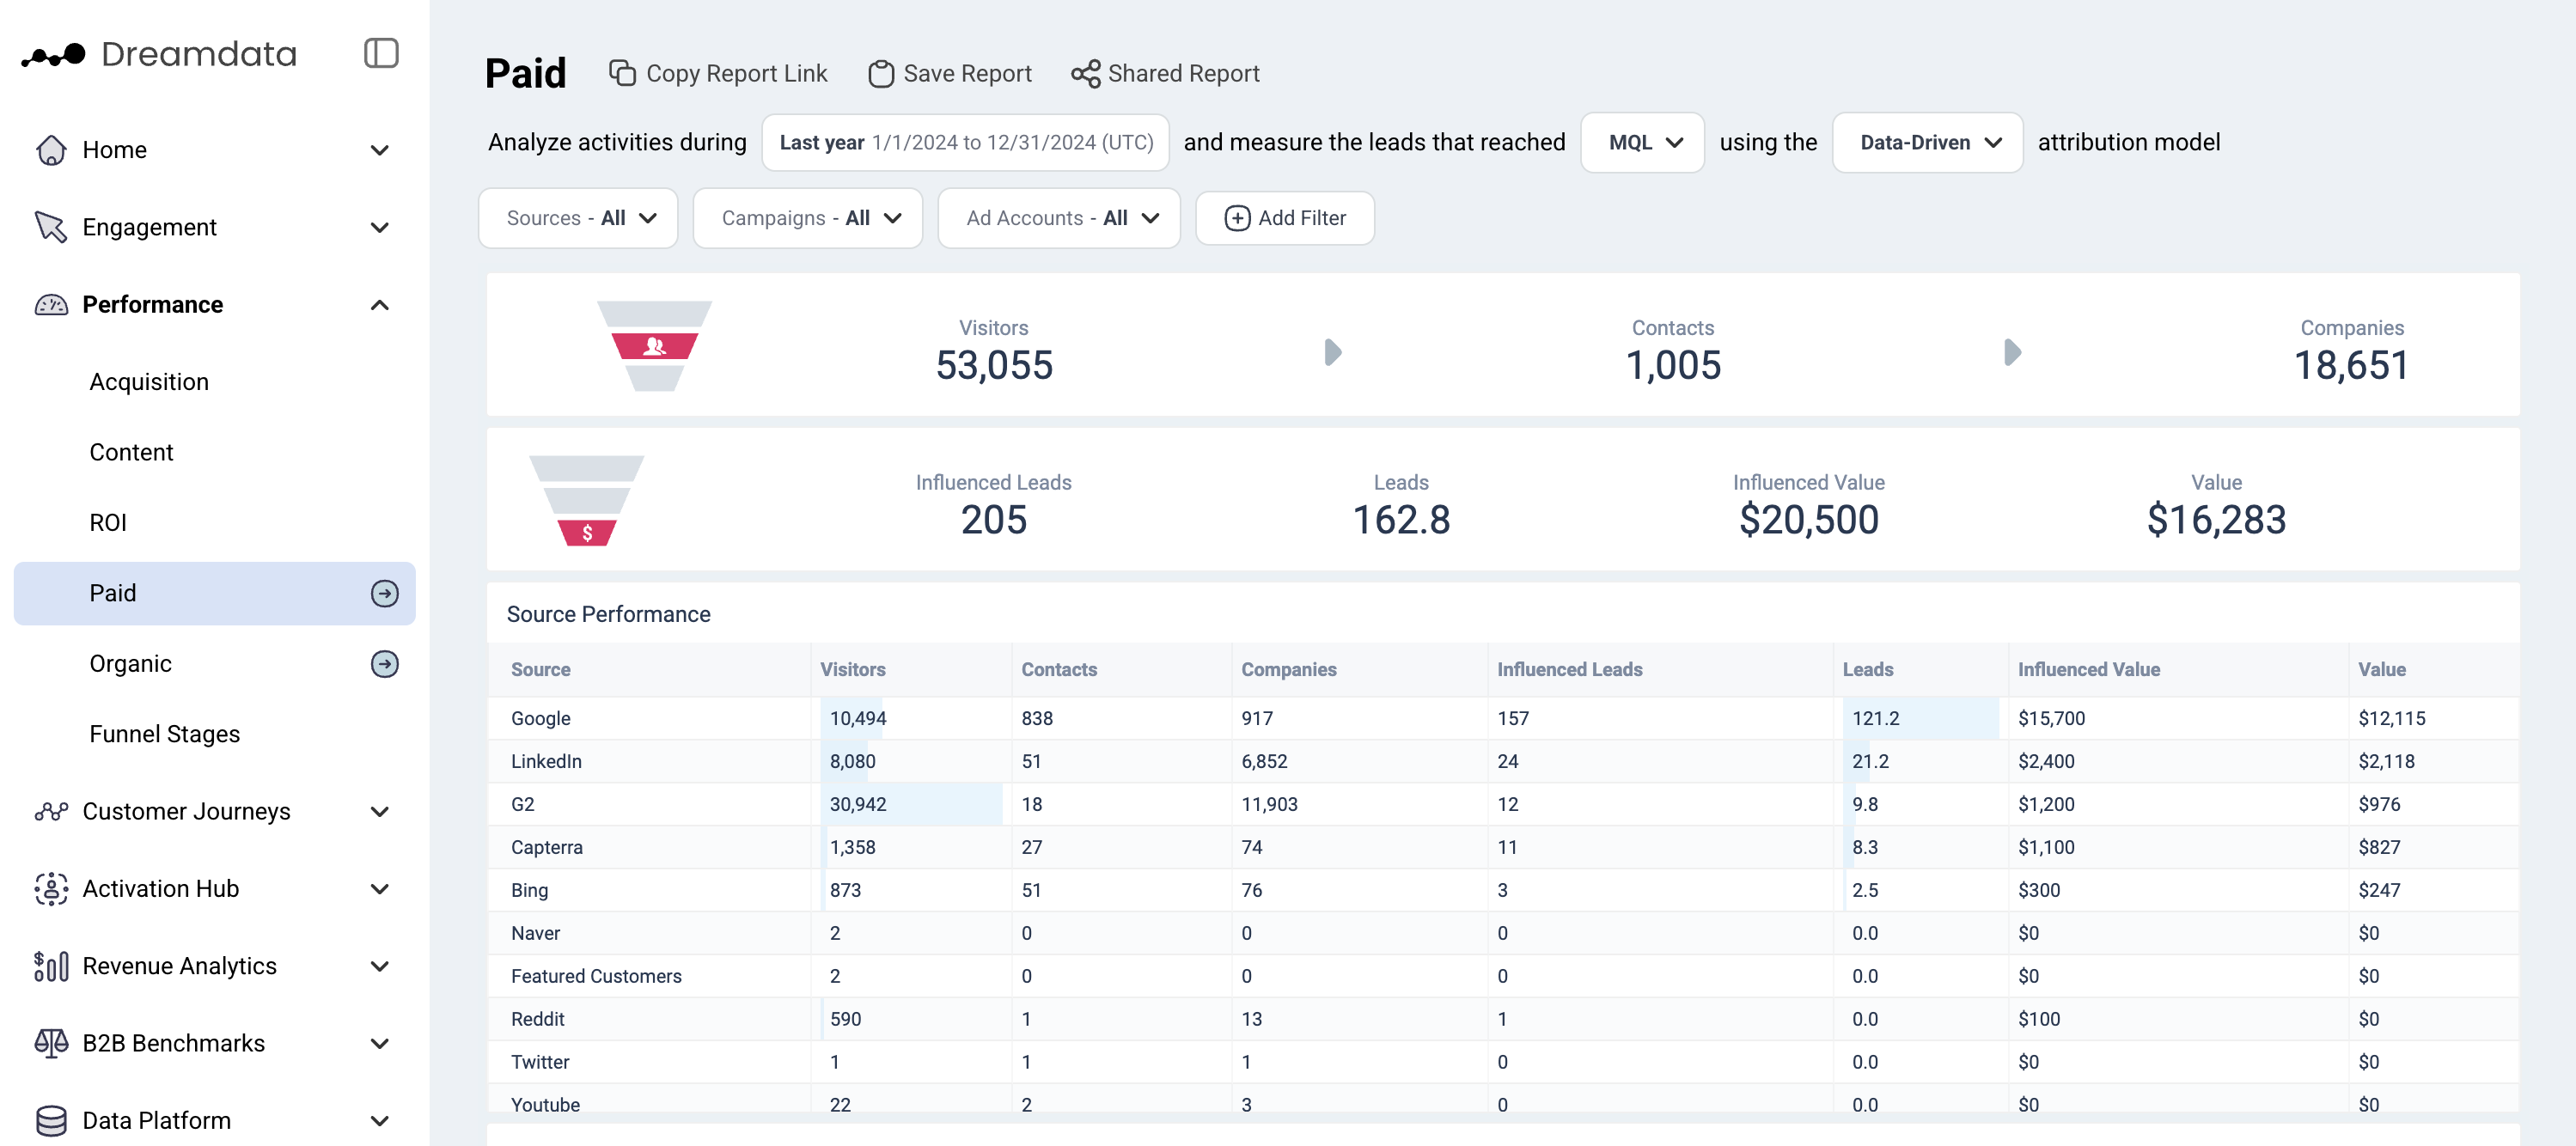
This dashboard provides an overview of the performance of all your Ad Networks. It shows traffic levels along with how much attributable revenue and deals can be allocated to the Paid Channel. It also breaks down the performance by source and campaign, allowing you to compare and understand which activities are performing or not.
Filters

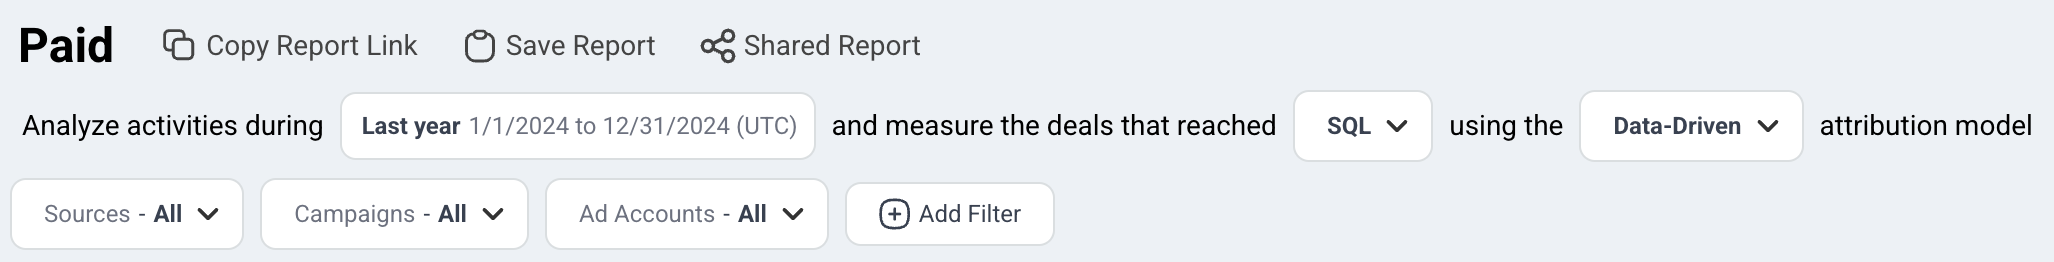
Date: Set the time period you want to investigate
Stage: You can select your preferred pipeline stage. Read more about the Free Tier Stages here
Attribution: Choose the attribution model which is meaningful for your analysis
- First Touch
- Last Touch
- Linear
- U-Shaped
- W-Shaped
Devices: Choose the device to analyse specific traffic
- Desktop
- Mobile
- Tablet
Ad Network: Choose the ad network
Note: Date is referring to the time period when visitors/contacts interacted with these Ad Networks
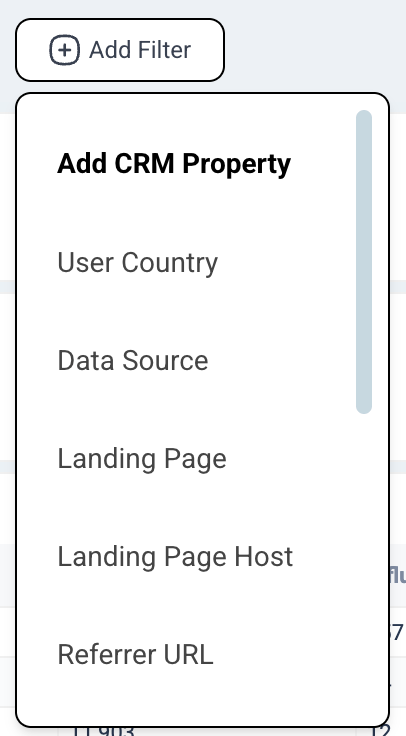
Metrics
Visitors: The number of unique users who had a website session which originated from Paid Ad Networks during the given time period
Contacts: The number of visitors who we have been able to attach an email to their user id
Companies: The number of companies who are attached to Contacts, or the number of companies in your CRM who we can be attached to any visitor traffic (anonymous)
Deals: The number of deals that are associated with Paid Ad Networks based on your selected filter
Value: The amount of revenue that is attributed to the Paid Ad Networks campaigns based on your selected filter
Funnel Overview

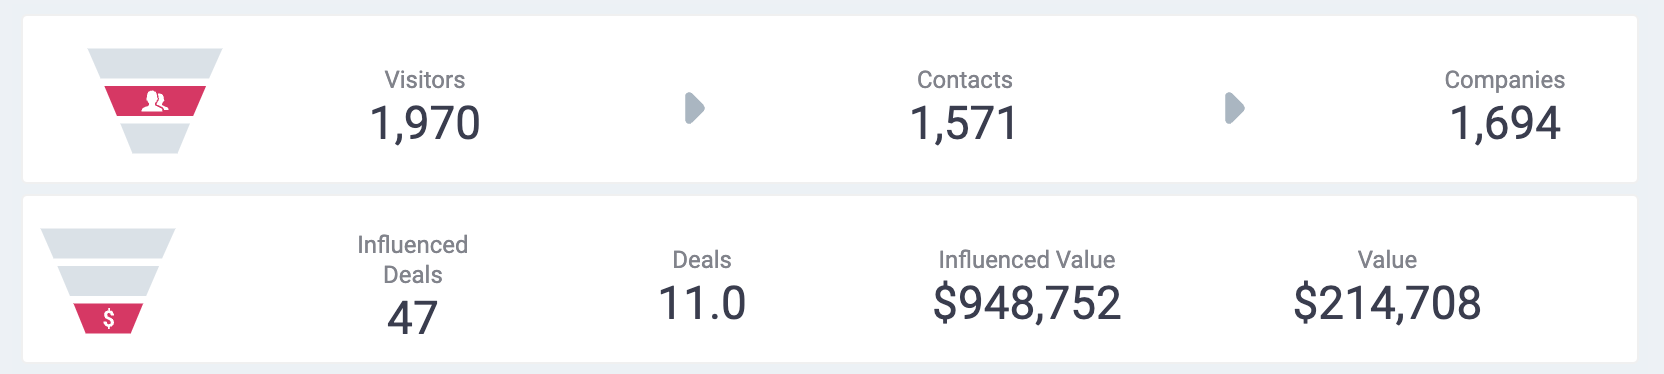
Visitors → Contacts → Companies
In this first section, we give an overview of the traffic from your Paid Channel which is based on the Tracking script we have on your websites.
Deals → Value
In the second section, we provide the total number of Attributable Deals and Attributable Value (revenue) that can be assigned to your Paid Channel based on the filters selected.
To calculate these numbers, we first look at the pool of contacts/companies that visited the ads based on the dates/filters. Once we have that group, we see what deals were closed after their visit, up to today's date. More importantly, we are only looking at deals where we have a recorded history of sessions, Attributable Deals. This pool of attributable deals will make up the basis for this section. For each of these deals and all their sessions, we will run the Attribution Model you have selected so each session is given a deal and revenue amount.
For both Attributable Deal and Value (revenue), we then provide the sum of these amounts for each session that contains Paid Channel, depending on which Attribution Model you have selected.
Note: When using First Touch/Last Touch you will get a round Deal number, as a deal is either First Touch Paid or Not. With Linear, W-Shaped or U-Shaped you will get a fraction of a deal as most Paid Touchpoints will make up a fraction of the sessions on a deal.
Graphs and Tables
Source Performance

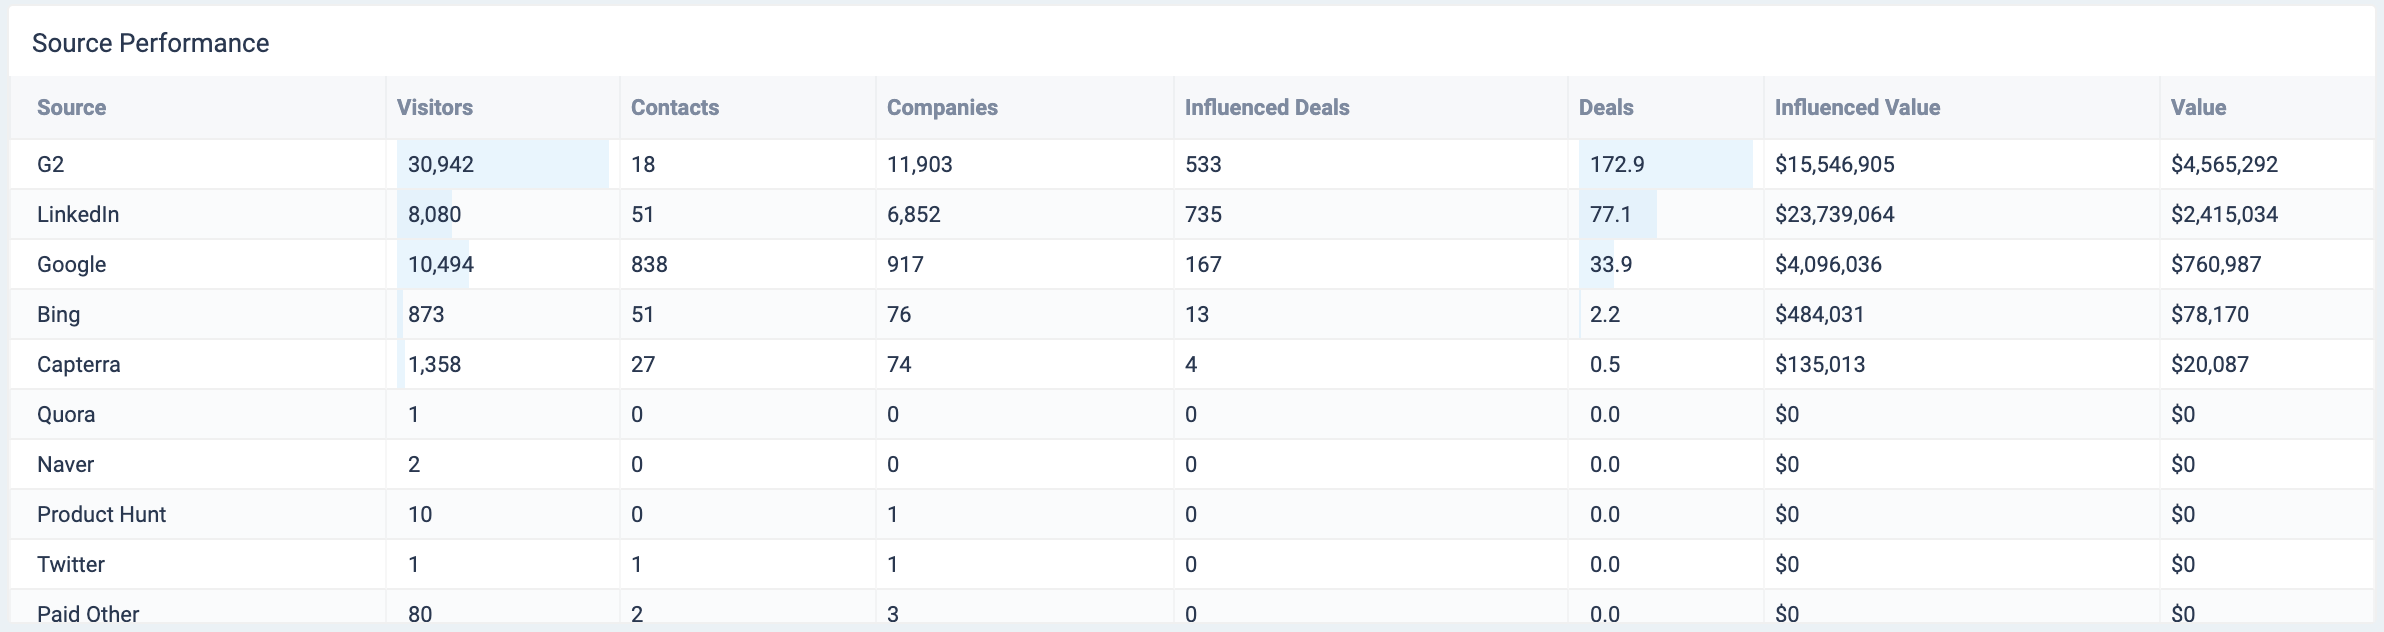
In this table, we provide an overview of the performance of your Ads by Source.
We provide a table listing all Sources (Ad Networks) that were available within the Paid sessions on the Attributable Deals. We breakdown their performance by showing Visitors, Contacts, Companies, Attributable Deals and Attributable Value.
Note: These numbers don't always match the totals shown in the first two sections of this Dashboard as not all sessions contain a source.
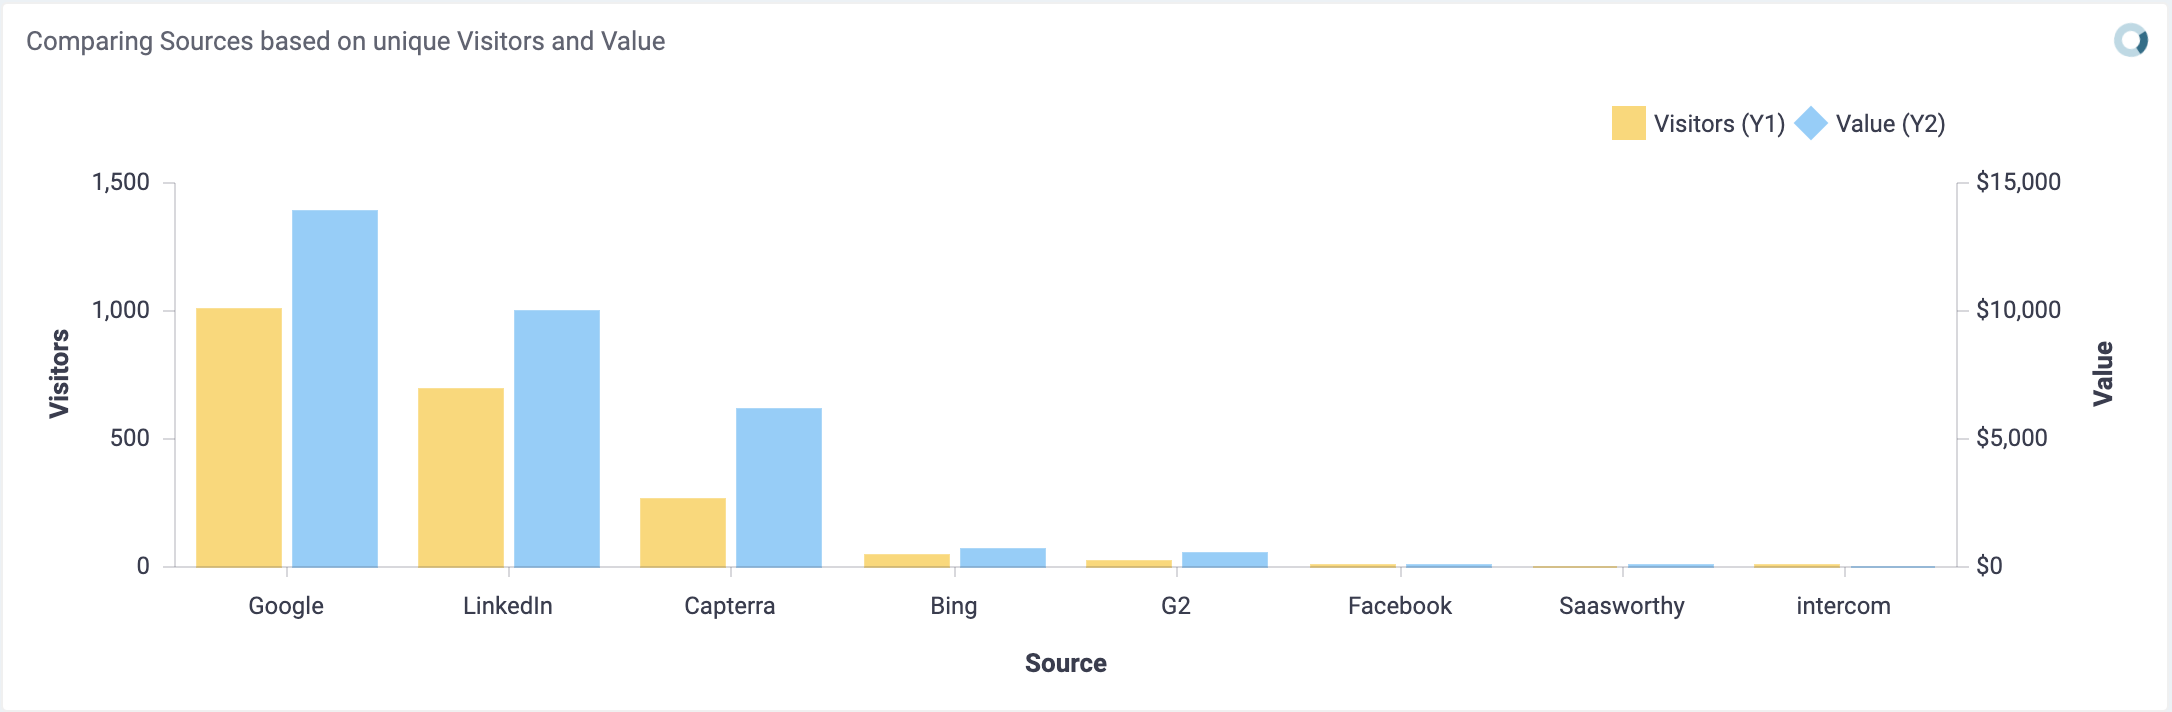
Comparing Sources (Ad Networks) based on unique Visitors and Value
In this graph we visualise your Ad Networks performance, we do that by comparing Visitors over Value generated from each Source. This graph helps to understand which Sources (Ad Networks) convert better.
Campaign Performance

In this table we list all Campaigns and breakdown their performance (metrics) by showing Source, Visitors, Contacts, Companies, Attributable Deals and Attributable Revenue.
Note: These numbers don't always match the totals shown in the first two sections of this Dashboard as not all sessions contain a source.