Google Search Ads
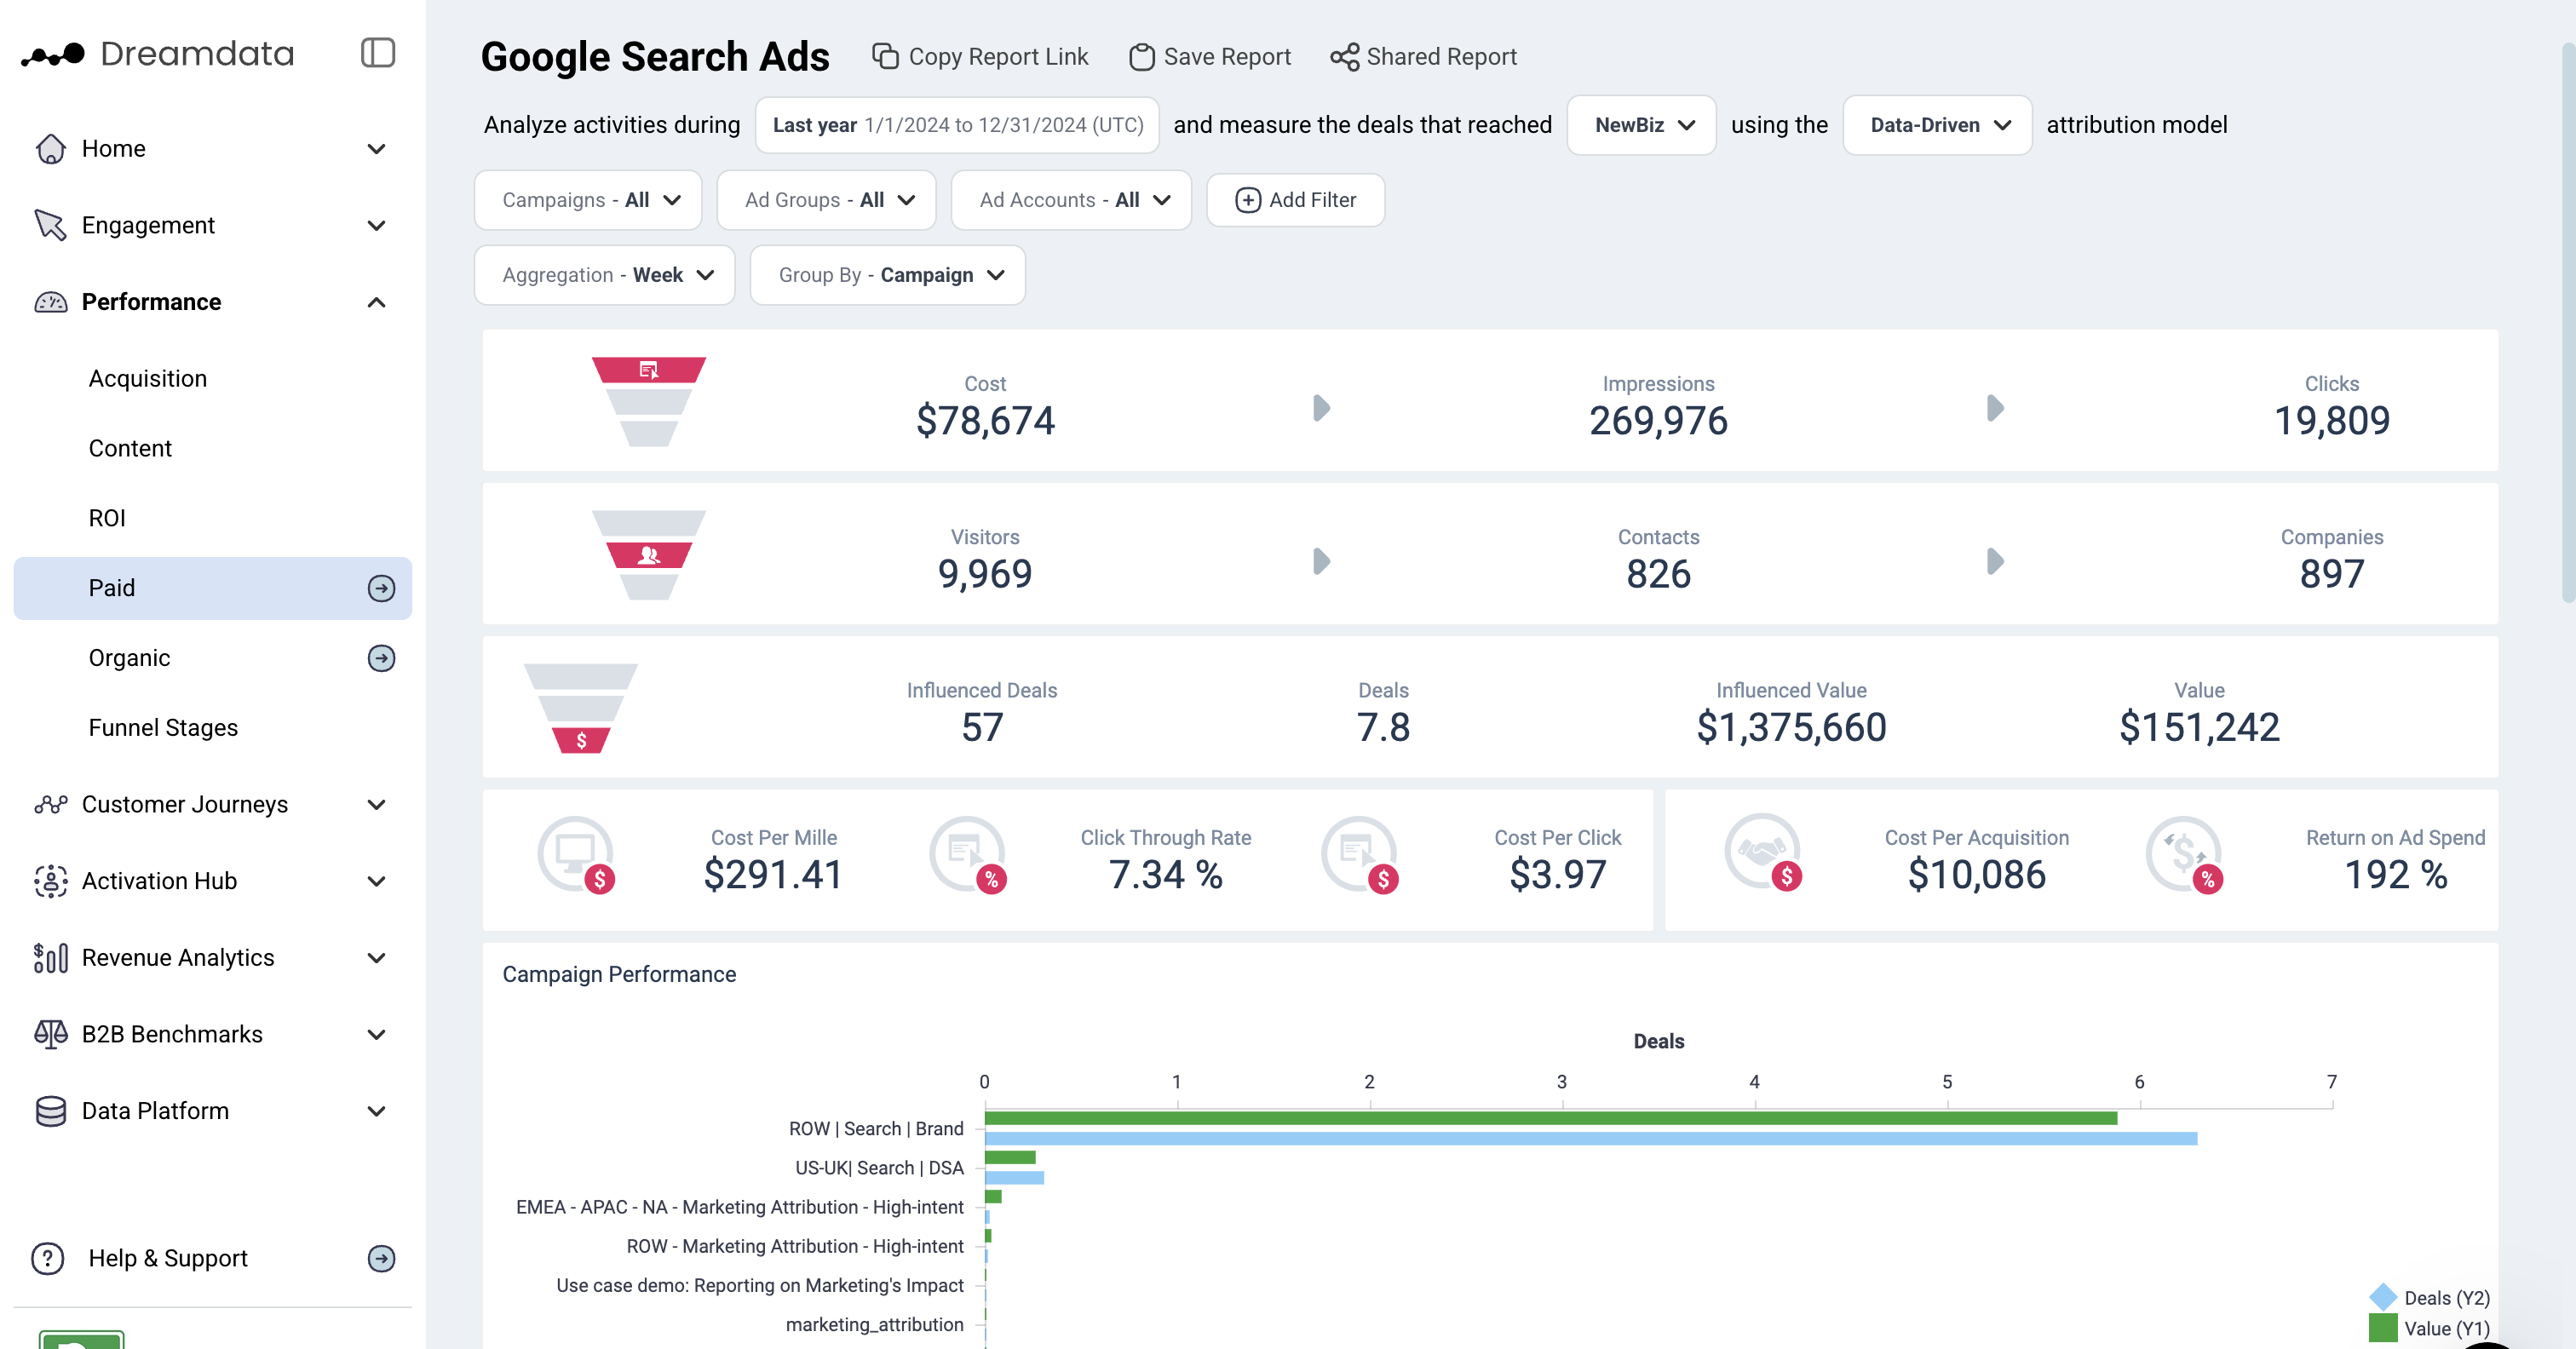
With this dashboard, we give users all the info they need to understand how their Google Search and Smart Ads are performing, particularly in regards to generating Revenue. From the overall funnel, down to campaign and search query level, you get the full perspective and can make data supported decisions and strategy.
Filters
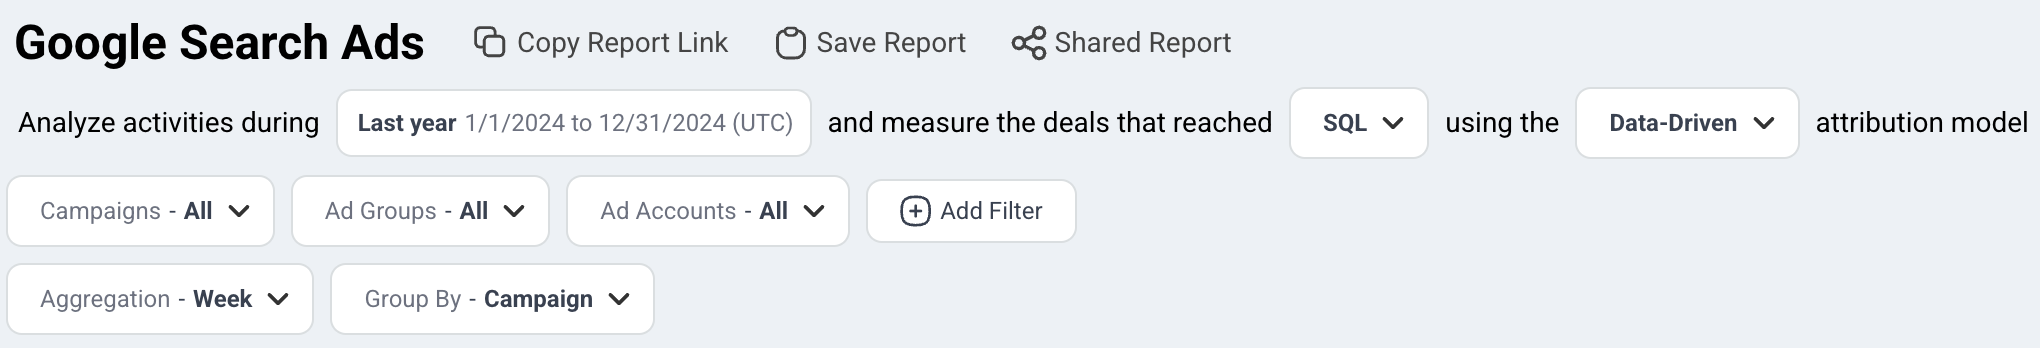
Date: Set the time period you want to investigate
Stage: You can select your preferred pipeline stage. Read more about the Free Tier Stages here
Attribution: Choose the attribution model which is meaningful for your analysis
- First Touch
- Last Touch
- Linear
- U-Shaped
- W-Shaped
- Data-driven
Campaigns: Choose the campaign you want to investigate
Ad Groups: Choose the ad groups you want to analyse
Ad Accounts: Choose the ad account/s you are interested in
Aggregation: Set the time frames you wish to display your data in
Group By: Choose your preferred option to group by
- Campaign
- Ad Group
- Keyword: performance (impressions, visitors, deals, etc..) of your keywords.
- Bid Strategy: can help you compare different bid strategies and help you make a decision on choosing bid strategy when you set up campaigns.
- User Country: shows where your campaign click events happen, and which regions bring more value than others.
- Ad Account
Note: Date is referring to the time period when visitors/contacts interacted with any Google Ads
Funnel Overview
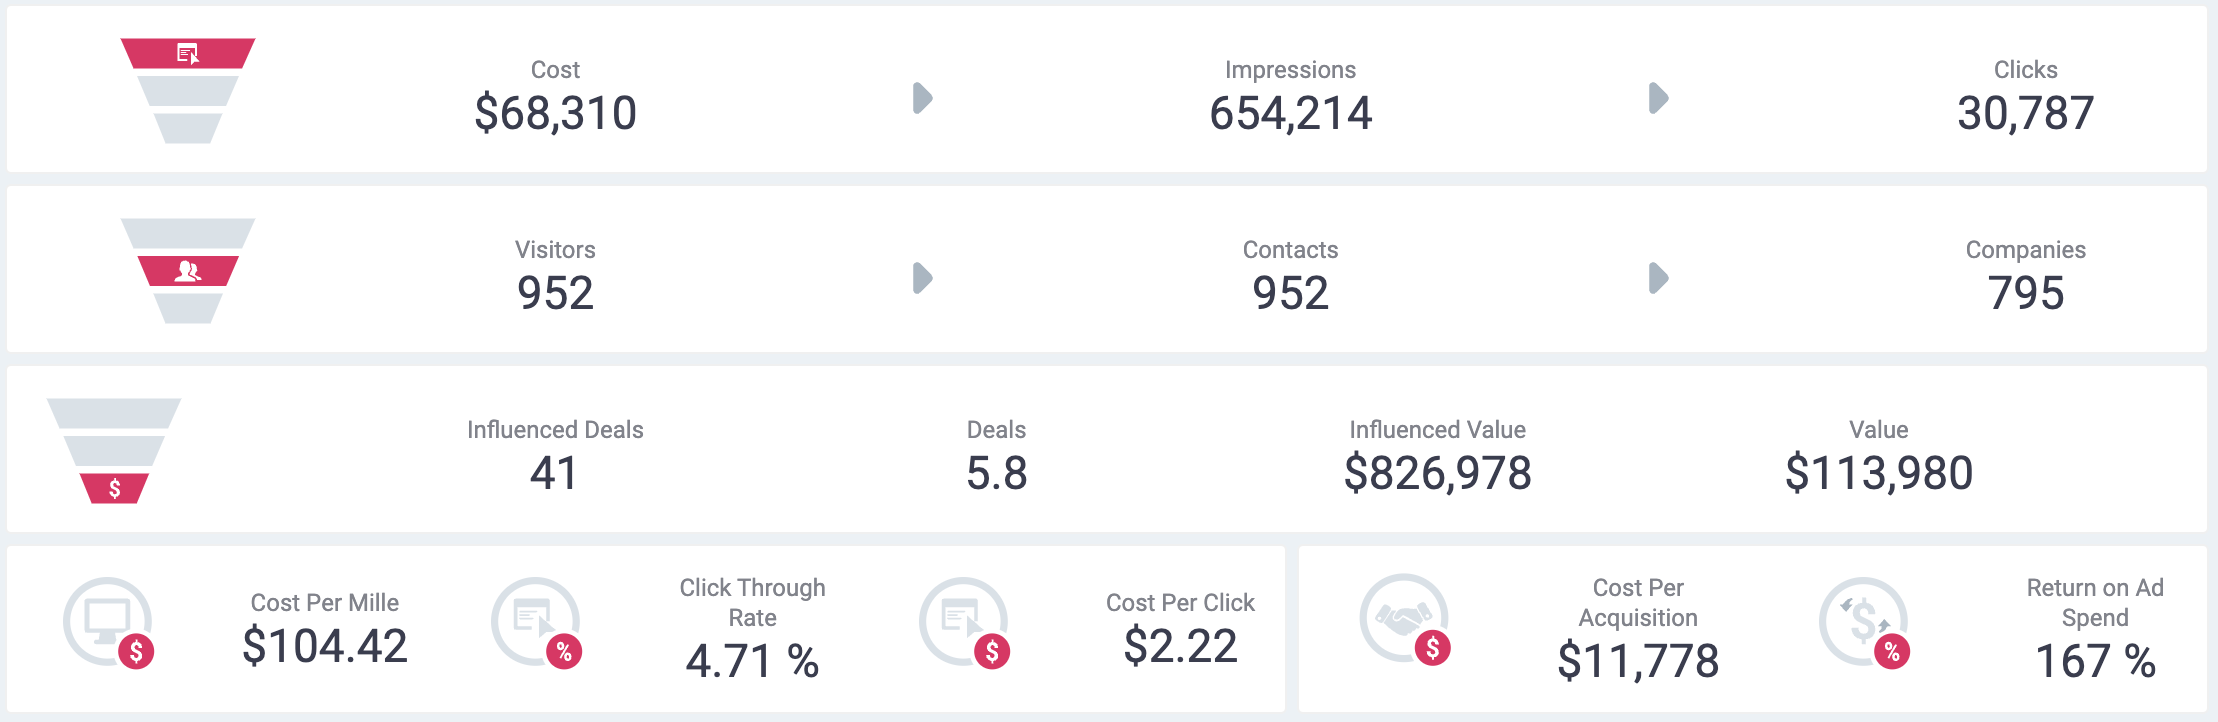
Cost: The Served Cost of all the clicks or impressions that the campaign received. Please note that there is difference between Served Cost and Billed Cost. Google Ads API currently does not expose Billed Cost metric.
Impressions: The number of times your Search and Smart ads are shown. Each time your ad appears on someone's feed it is counted as an impression.
Clicks: The amount of Search and Smart campaign clicks recorded by Google Ads
Visitors: The number of unique users who landed to your website from your Google Search or Smart ads
Contacts: The number of visitors who we have been able to attach an email to their user id
Companies: The number of companies who are attached to Contacts, or the number of companies in your CRM who we can be attached to any visitor traffic (anonymous)
Influenced Deals: & Value: The number of deals who visited a Search or Smart campaign (based on the dates/filters selected) and the value (revenue) of those deals. These two metrics are not controlled by your selected attribution model.
Deals & Value: The number of deals that who visited a Search or Smart campaigns (based on the dates/filters selected) with the selected attribution model applied. The value is the total revenue from these deals.
Cost per Mille (cpm): Cost per thousand, this calculation is used to denote the price over 1,000 impressions
Click Through Rate (ctr): Clicks divided by Impressions
Cost Per Click (cpc): Total Cost divided by Clicks
Cost Per Acquisition (cpa): Total Cost divided by Attributable Deals
Return on Ad Spend (ROAS): Total Attributable Revenue divided by Total Cost
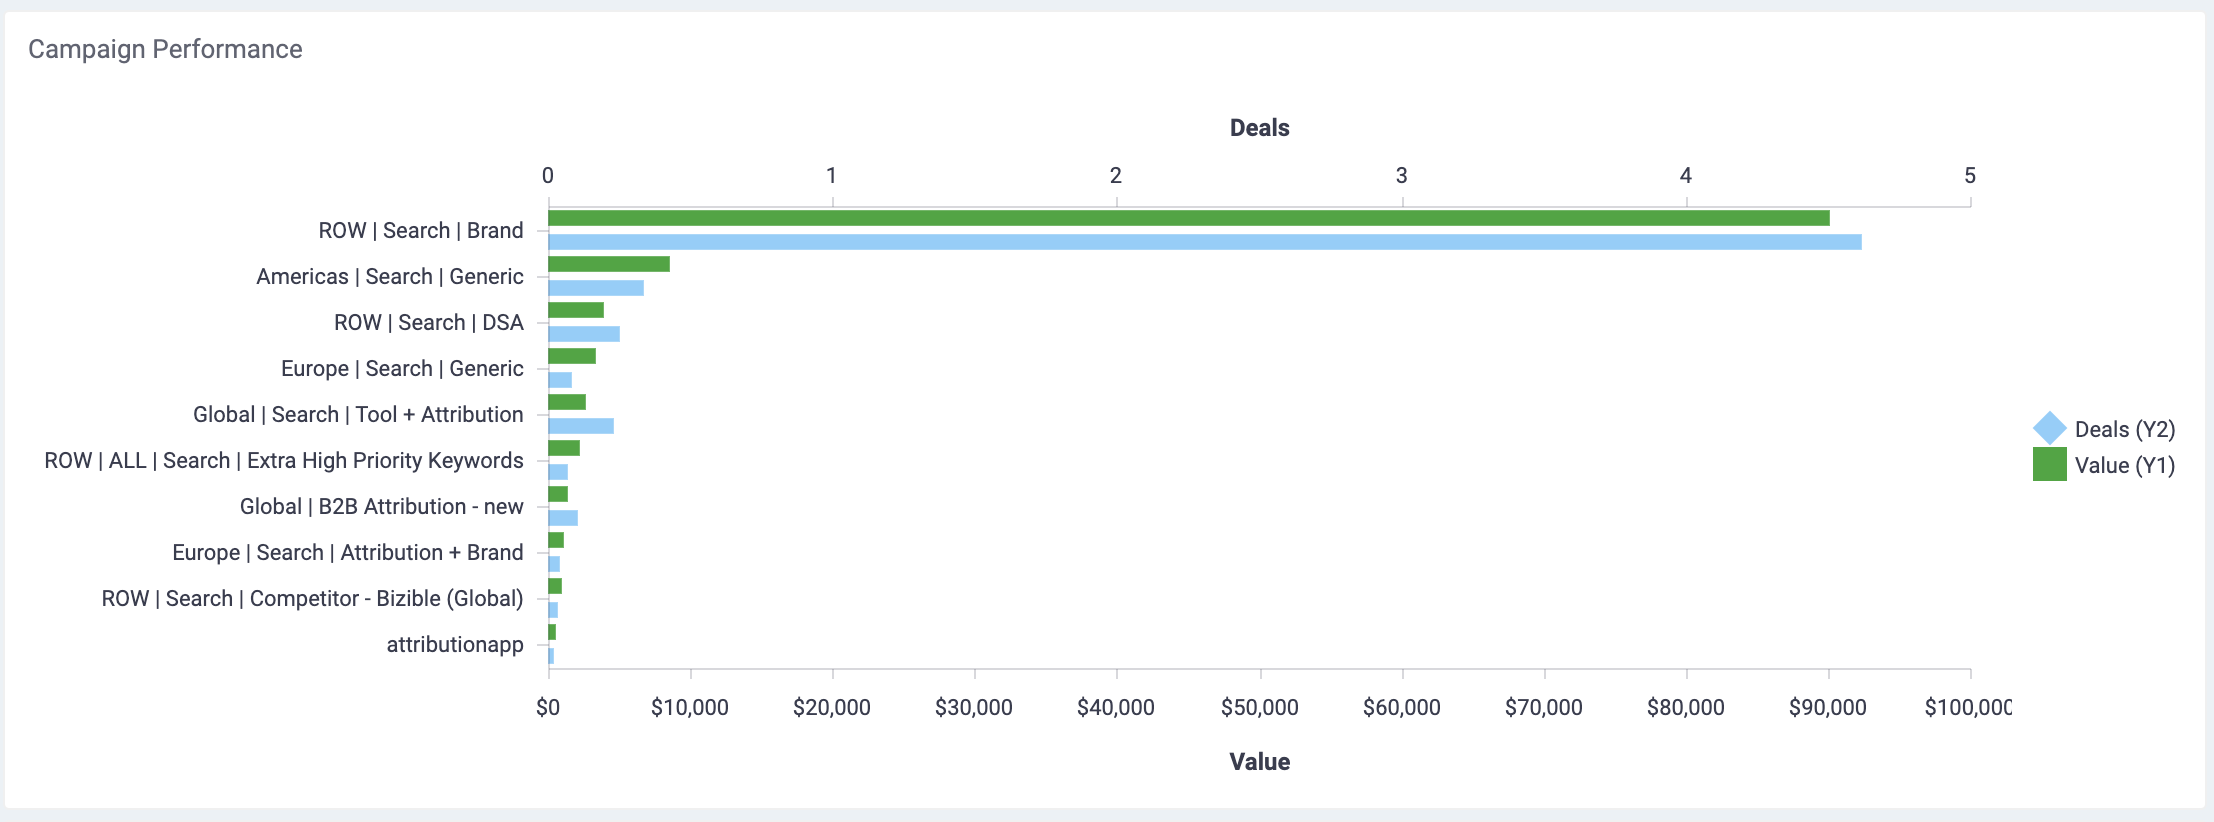
Google Search Performance Graph
The first graph shows you the performance of each of your Google Search Ads on a campaign, Ad group, Keyword, Bid strategy or User country level. You can select which one you would like to see using the 'Group By' filter.
Google Search Performance Table
In this table, we list all the Search, Smart Campaigns and Ad Groups in Google Ads that were running during the time frame specified. Again you can use the 'Group By' filter to specify what you'd like to see here.
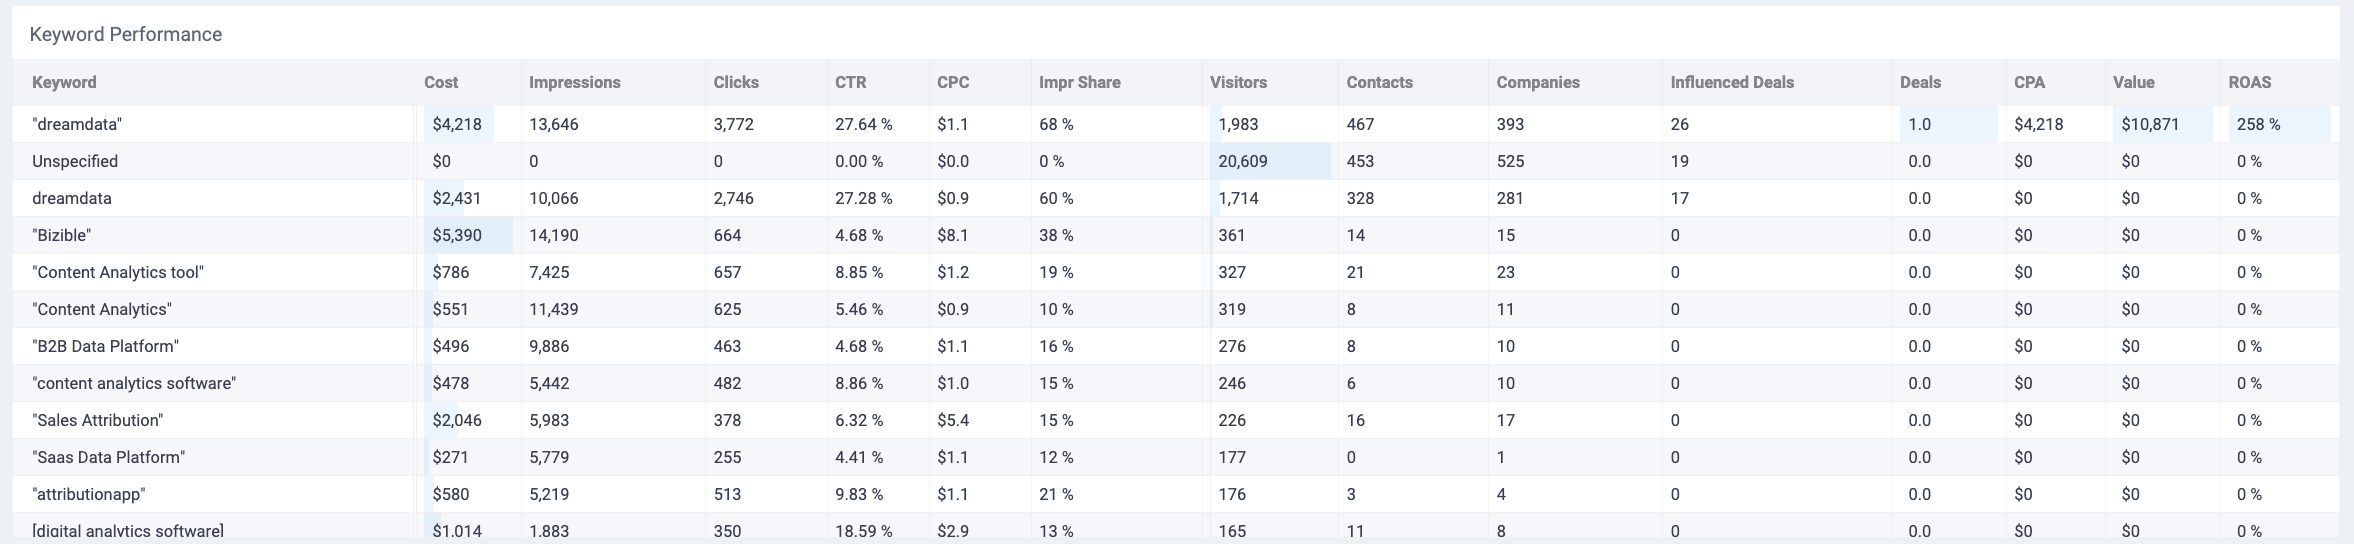
Metrics
Impression Share: The percentage of impressions that your ads receive compared to the total number of impressions that your ads could get.
Keyword: The keyword that is set up in your campaigns. Keyword is the triggered keyword for the paid ad, not the exact search the visitor made.
keyword match types: Displayed keywords in your Dreamdata app are now marked with punctuations. This is done to help you understand your chosen keywords match type.
Below you'll find the 4 keyword match types:
Broad Match is the only type of keyword that is not marked with any punctuation. | i.e. | Broad Match: Dreamdata |
Modified Broad Match keywords are marked with + | i.e. | Modified Broad Match: +Dreamdata |
Phrase Match keywords are marked with " " | i.e. | Phrase Match: "Dreamdata" |
Exact Match keywords are marked with [ ] | i.e. | Exact Match: [Dreamdata] |
Performance over time
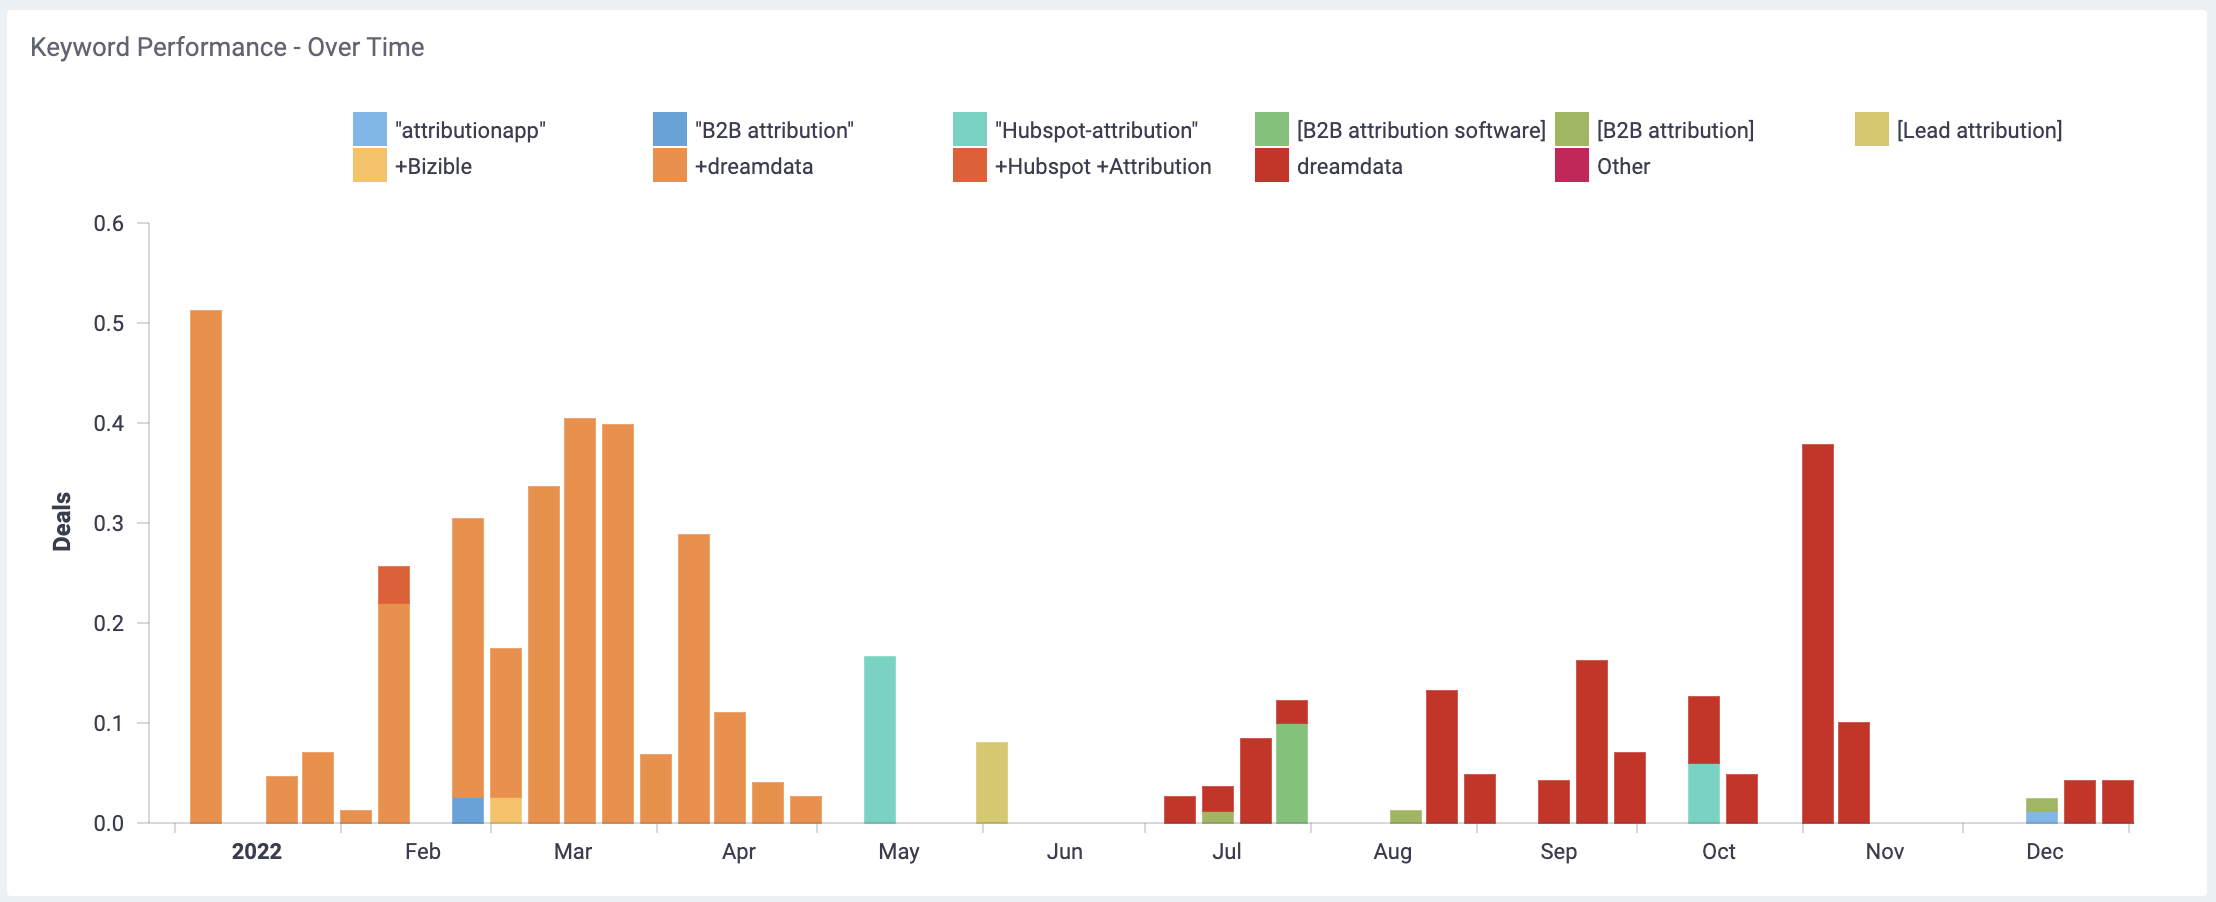
We provide a graph showing the development of your Google Ad Campaigns/Keywords/Ad group/Bid strategy/User country (select these in 'Group By' filter) and their attributed revenue over the period of time specified with the Date filter. Use the Aggregate filter to breakdown the X-Axis as you wish e.g. week vs month.
This graph makes it easy to see which Campaigns, keywords etc. are performing best, but also it shows how long it generally takes for a campaign to provide a Return. Time frame is the key, remember to give enough time to your campaigns to create value.
Search Term Performance
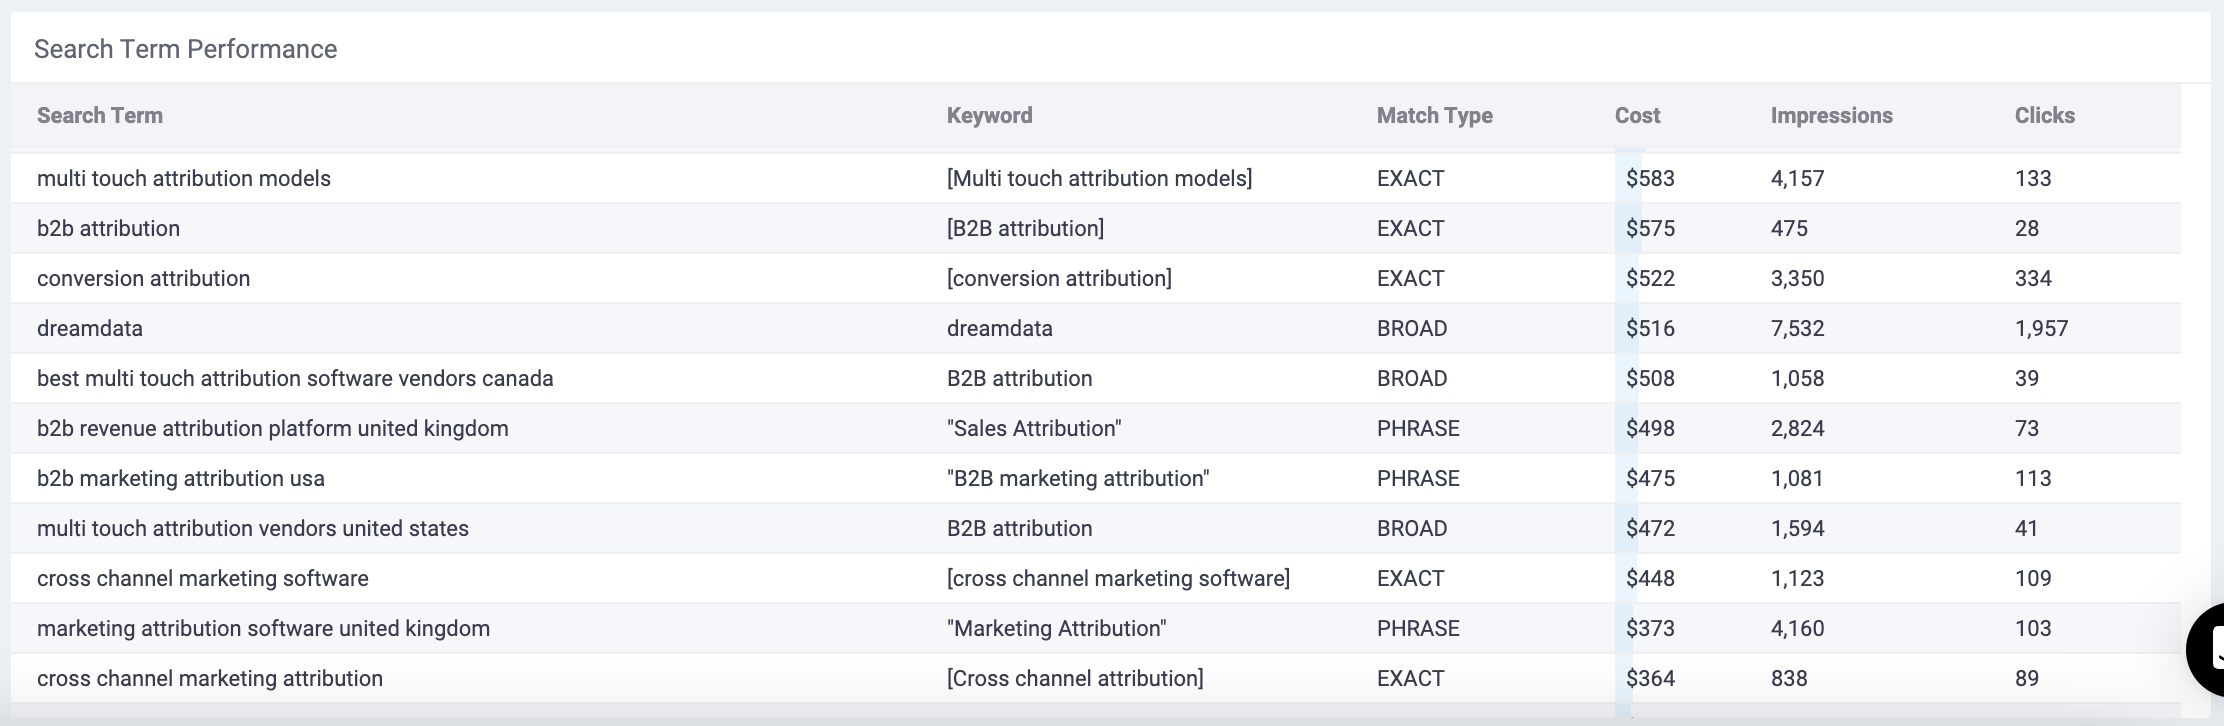
We provide a table with peoples' search terms that have matched your paid keywords. This analysis helps to understand the math type between your keyword and search term. The keywords are then broken down into: cost, impressions and clicks involved.
Data Freshness
Google Ads data in Dreamdata can have up to 72 hours delay due to the nature of Google Ads API, which means there will be discrepancies if you compare the latest 3 days data between Dreamdata and Google Ads. Here is the Google Ads data freshness documentation.
Google Smart Ads
Google Smart Ads report supports Performance Max campaigns and Smart campaigns.