Ad Spend
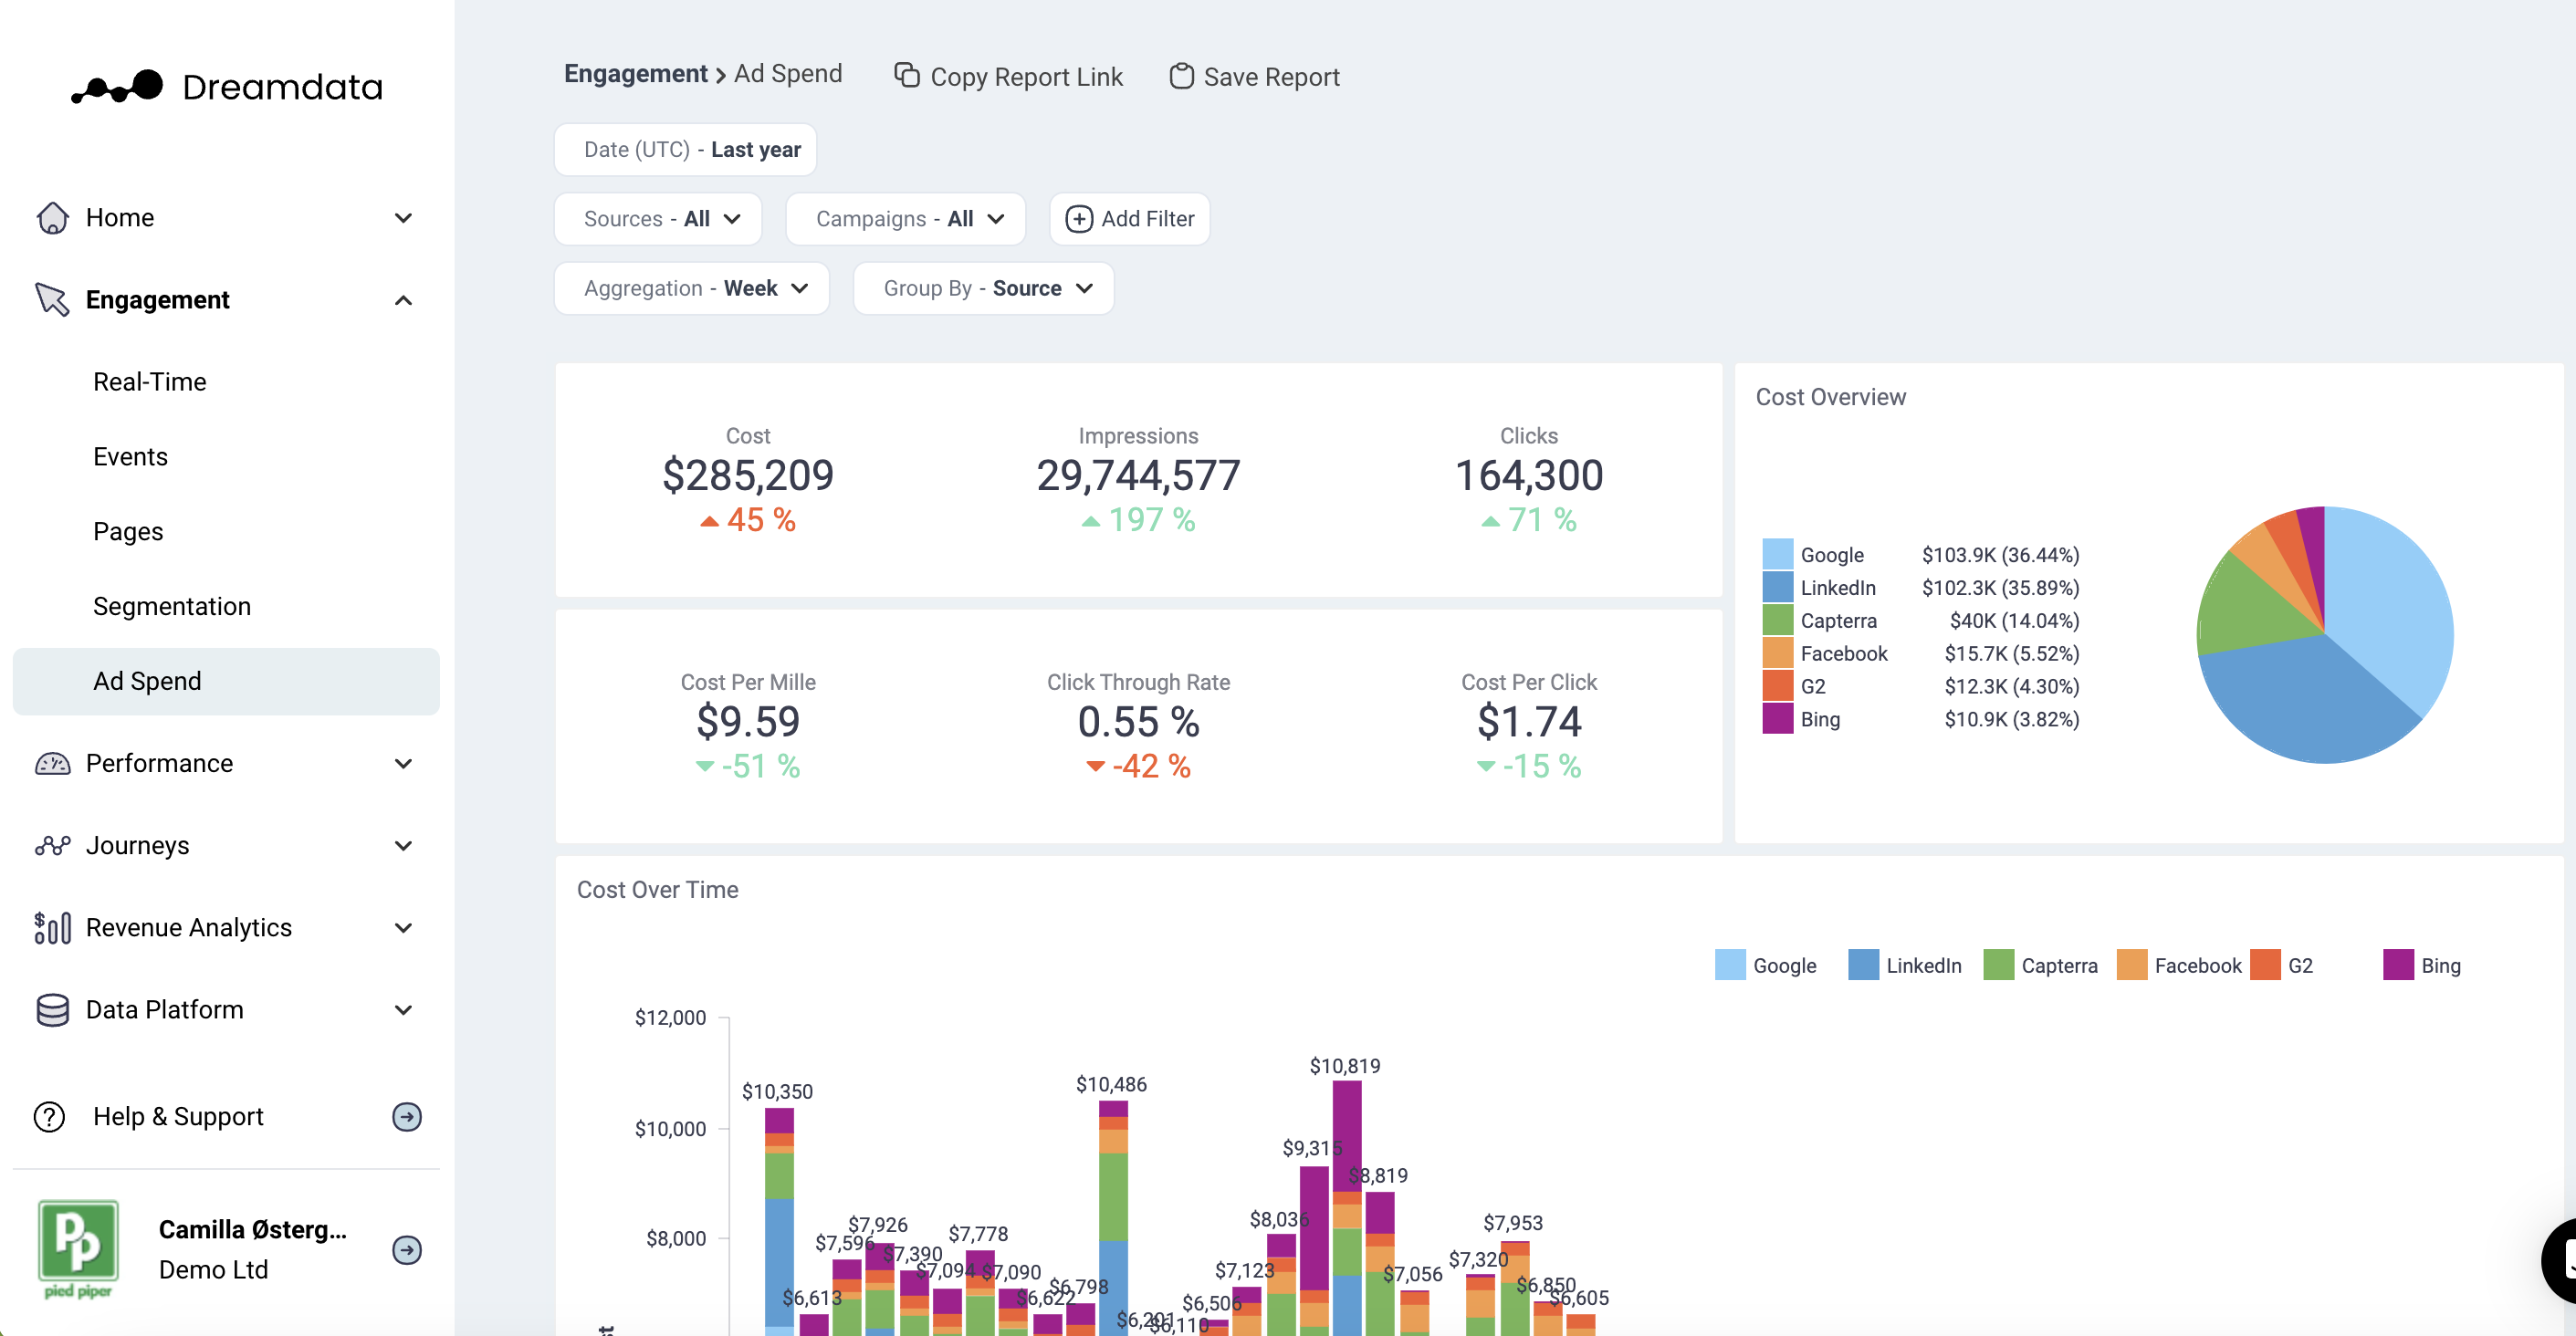
This dashboard provides an overview of your Ads Cost in total as well as per each Ad Network. This report breaks down the Total Cost into smaller metrics like cost per mille and cost per click. Group By filter allows to investigate the performance of different Ad Networks and Campaigns.
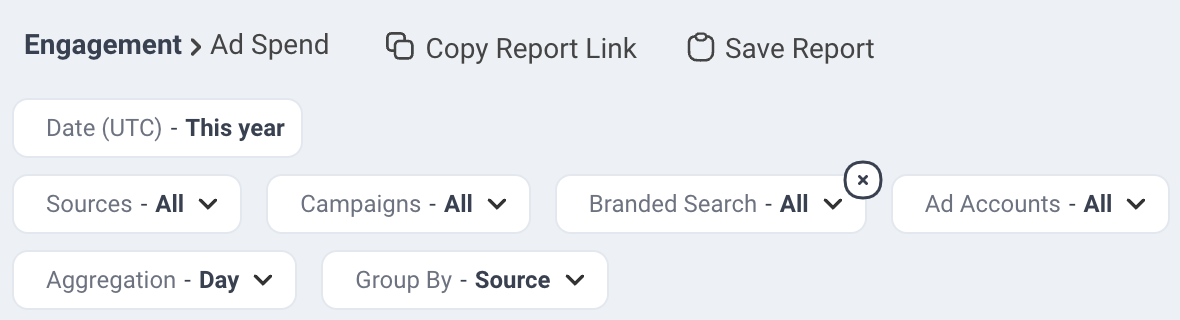
Filters
Date: Set the time period you want to investigate
Sources: Choose the source/ad network
Campaign: Choose campaign
Branded Search: Filter by branded or non-branded campaigns
Ad Accounts: Choose the ad account/s you are interested in
Aggregation: Set the time frames you wish to display your data in
Group By: Choose different options to see how it affects your deals
- Source
- Campaign
- Branded Search
- Source + Branded Search
- Ad Account
Metrics
Cost: The cost of your ad spend
Impressions: The number of times your ad is shown - each time your ad appears on someone's feed it is counted as an impression
Clicks: The number of clicks recorded on your ads
Cost Per Mille (cpm): Cost per thousand - this calculation is used to denote the price over one thousand impressions
Click Through Rate (ctr): Clicks divided by Impressions
Cost Per Click (cpc): Total Cost divided by Clicks
Funnel Overview
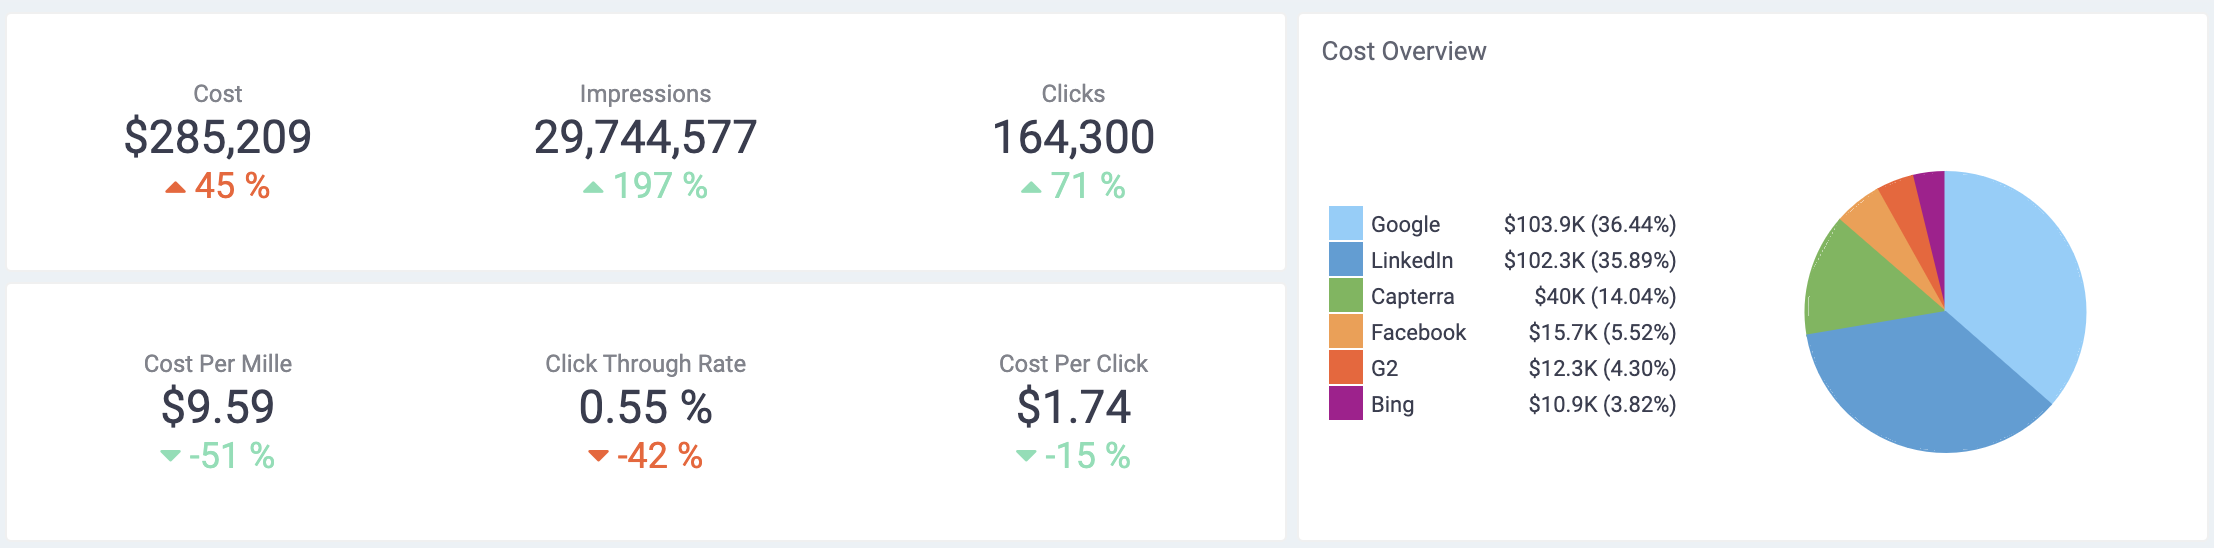
Cost → Impressions → Clicks
In this first section, we provide the top of the funnel for your Sources/Ad Networks Costs and outcomes (Impressions, Clicks) for the given time period. This data is pulled directly through our integrations.
Cost per Mille → Click through Rate → Cost per Click
In this row, we provide detailed cost metrics that allow us to take an in-depth look at the costs of our Ad Networks.
Graphs and Tables
Ad Network Cost over Time
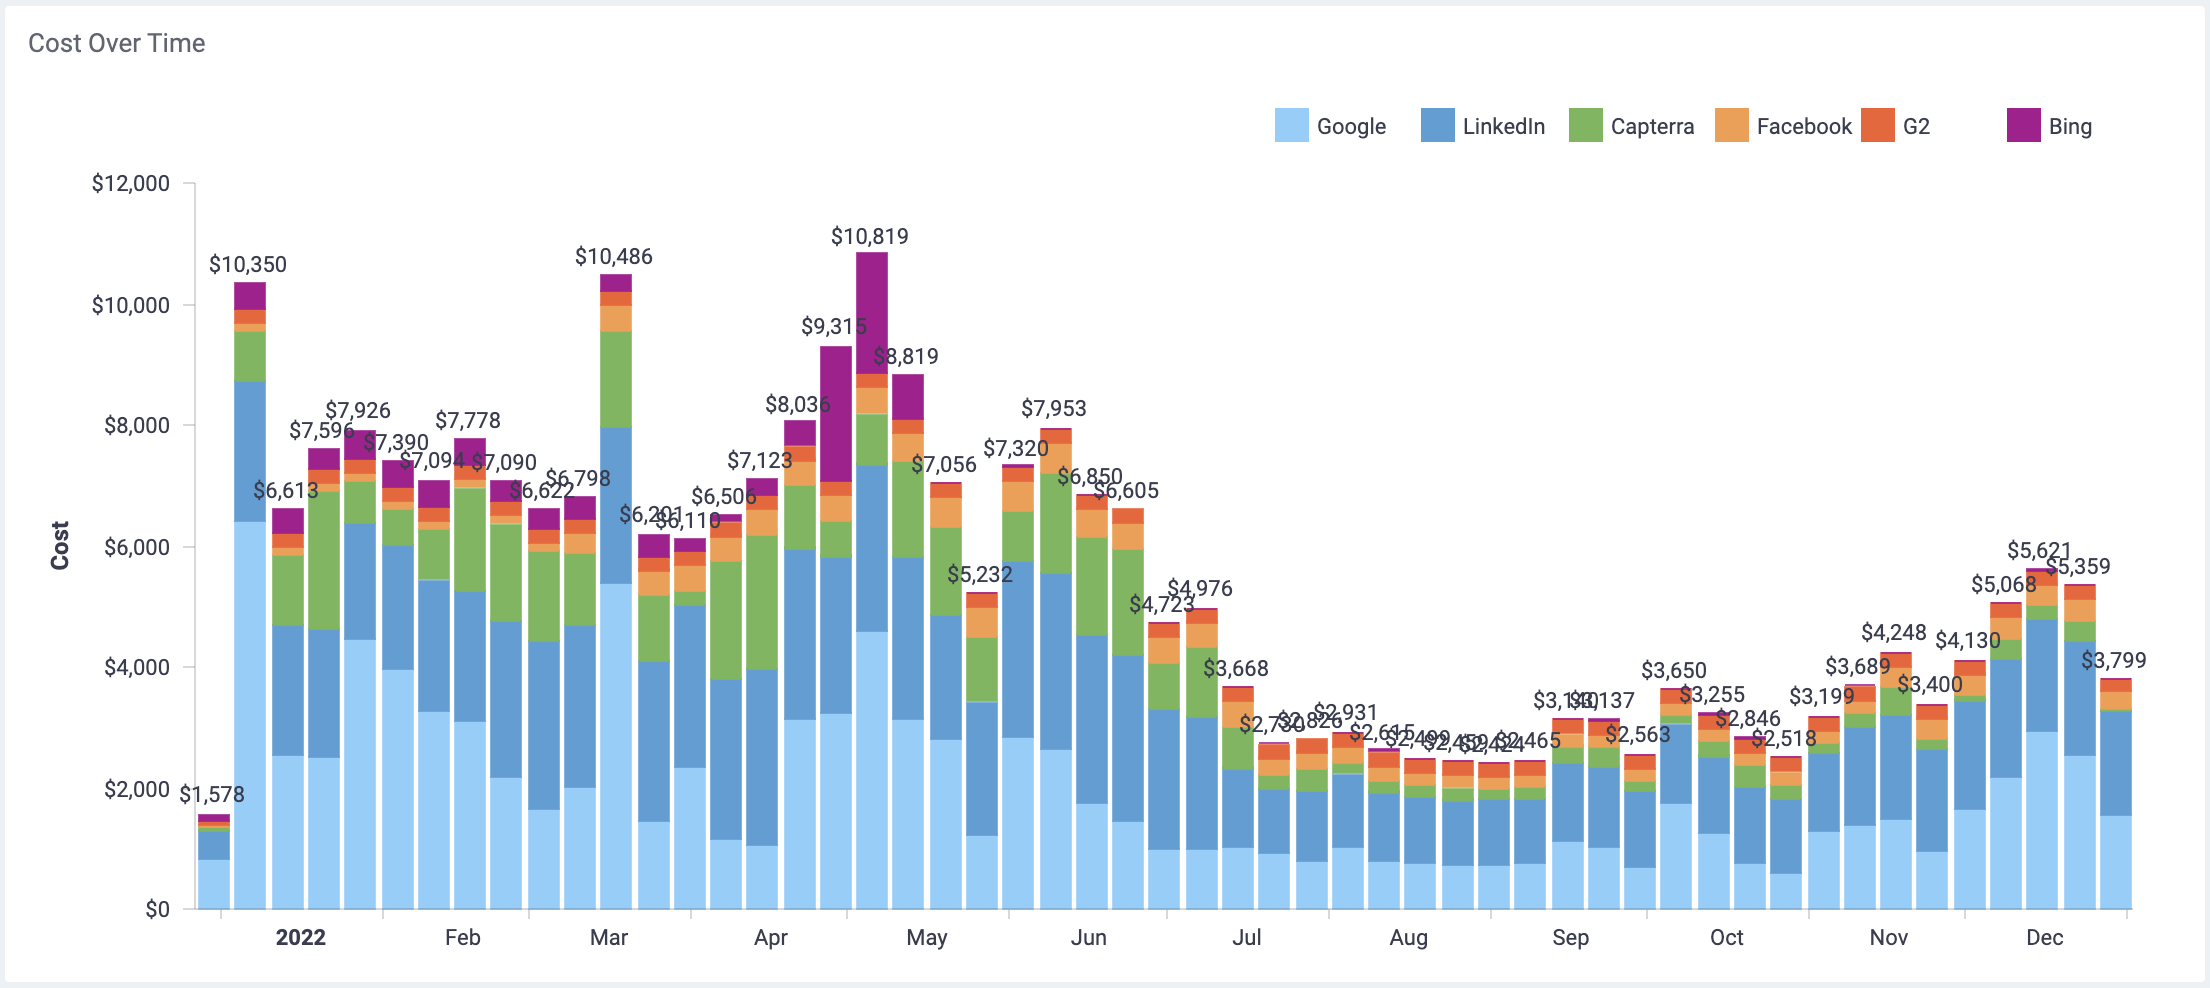
In this graph we visualise your Source Costs, we do that by displaying each Source Cost along with Total Cost over chosen time frame. This graph helps to understand which Sources you spend the most money on. Use the Aggregate filter to breakdown the X-Axis as you wish e.g. (day, week, month).
Note: You can select which Sources to hide/display by simply clicking the boxes on the top right corner.
Paid metrics - Over Time
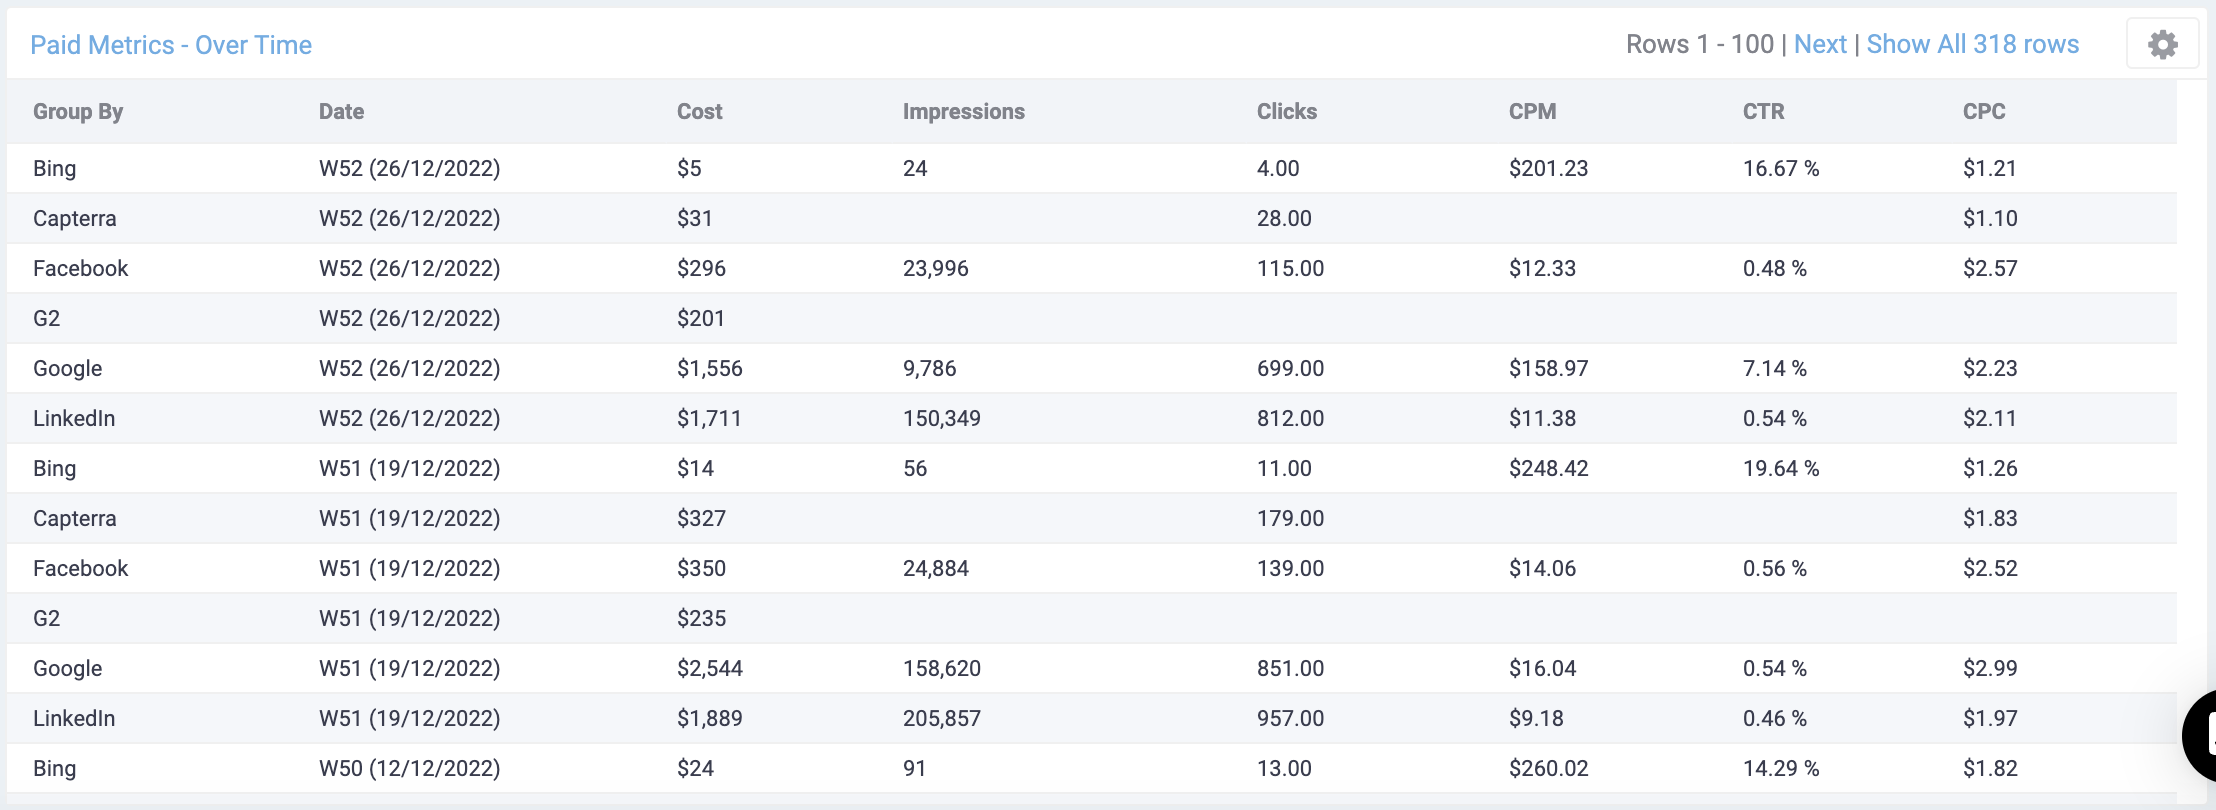
We provide a table listing the Cost and Performance metrics of each specific source/Ad Network. This analysis is used for investigating individual Ad Networks as well as comparing their performance in relation to each other.
Note: Deals and Value are not included in this table, to find these metrics go to the ROAS dashboard.