Pages report
Engagement → Pages are similar to Engagement → Events, but while the 'Events' report looks at all tracked events, the 'Pages' report only looks at events on specific pages.
This naturally includes events like page_views, and also form submission events, which are normally tracked on a specific URL page.
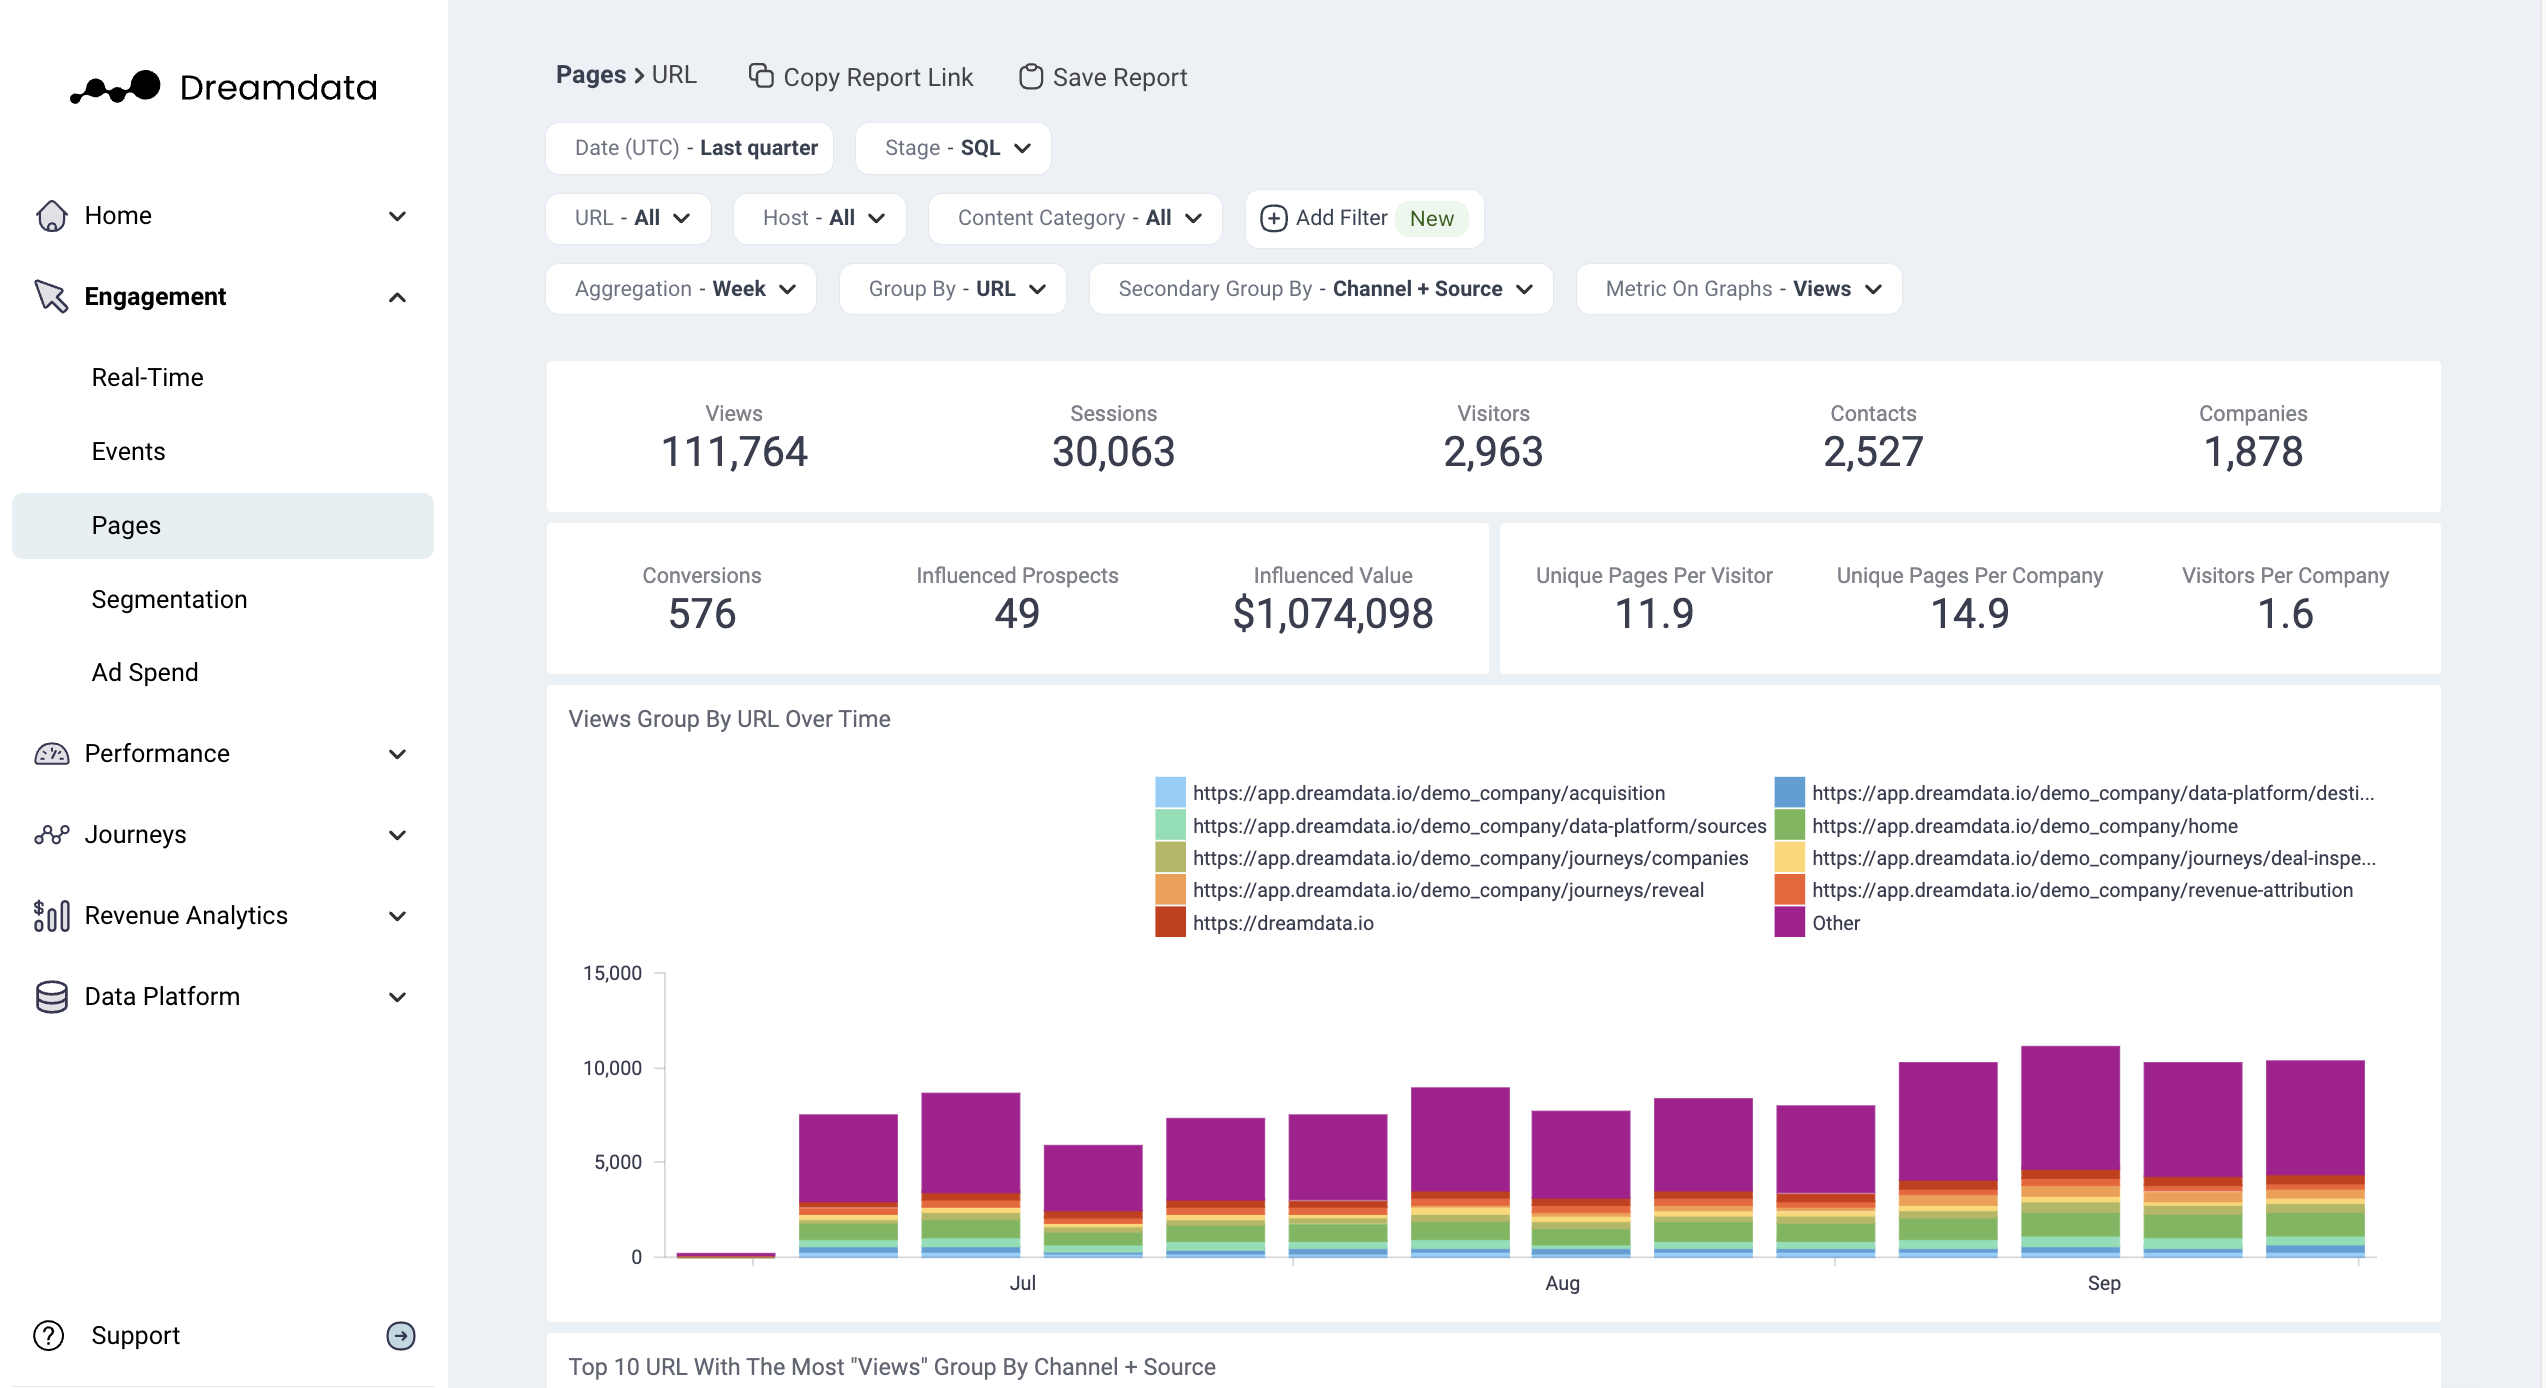
The report allows for analysis of which pages perform the best in terms of views, visitors, companies, conversions, average time spent on the page, engagement rate and/or pipeline metrics.
So, what's special about this report?
- It provides clear comparisons between Google Search Console and Dreamdata metrics.
- You can analyze which countries your page viewers are from.
- It includes graphs that display sessions, page visitors, conversions, contacts, companies, and more.
- Notably, you can view conversion and engagement rates for each page.
Typical questions you will find answers to with the Pages report
Which page has the highest number of visitors or the best conversion rate?
People familiar with Google’s Universal Analytics (GA3) will also find a familiar Landing Page analysis by simply changing the ‘Group By’ to Landing Page. (This report is no longer default in Google Analytics 4)
Which Landing Page drives the most conversions? Are people coming from Organic or Paid sources when entering a specific Landing Page?
Similar to Engagement → Events, we can segment each page by Channel, Source, Campaign, Referrer etc. to gain insights into the channels that people use to arrive at a specific page.
In addition to the origin of the traffic, we can segment each page by both visitor properties like country, device, etc. and company properties like industry and number of employees etc. Allowing for a deeper understanding of how different different segments engage with a page.
What industry do people viewing ‘blog/how-to-connect-engagement-with-revenue’ represent? Where do people viewing this URL come from?
The Engagement → Pages report has many similarities to Content Performance. Both are analyzing all events with a URL. The main difference is that the Engagement → Pages report focuses more on user-level metrics ie. how many visitors, companies, visiting time, and engagement rate. Whereas Content Performance focuses more on the performance of each URL in terms of pipeline generation. In this way, Content Performance is a more opinionated report, whereas Engagement → Pages is of a more summarizing nature.
Funnel like analysis of the conversion from seeing a specific page to a desired business outcome (a stage); of the companies that saw my pricing page, how many became a sales opportunity?
The Engagement → Pages report allows you to select everybody who saw a specific page in a certain time period and then see how many of those later went on to reach a specific business outcome (a stage). A typical scenario could be figuring out how many of the people that visited your pricing page, later became a sales opportunity or even new business.