Report Types
 Updated
by
Aleksandar Grbic
Updated
by
Aleksandar Grbic
Every report in Dreamdata Analytics Hub belongs to a report type. The report type determines what the report is designed to analyze and which fields appear in the configurator. There are six report types.
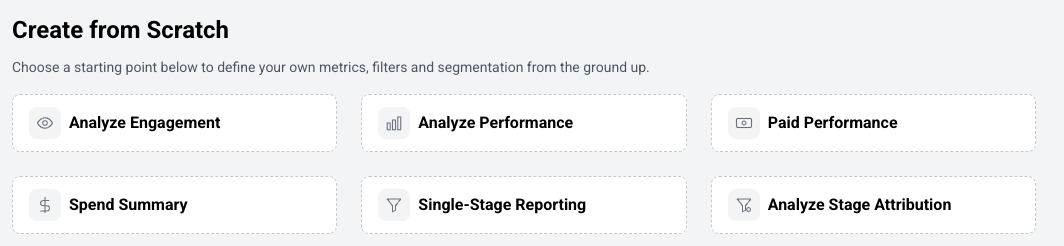
Choosing a Report Type
When creating a report, you choose a report type in one of two ways:
- Via a template — Each template belongs to a specific report type. Selecting a template automatically sets the report’s type. For example,
- Via "Create from Scratch" — Choose a report type directly without using a template.
The Six Report Types
Analyze Engagement
This report type helps you analyze touchpoints (events) such as button clicks, form submissions, and page views. It consolidates data on visitors, contacts, accounts, and the associated channels, sources, and campaigns for each interaction — helping you understand engagement patterns and their influence on pipeline development.
This report type behaves like a cohort analysis where the date range and filters define the cohort you are analyzing. The cohort can be defined by specific user events and specific user and company properties.
The metrics describe the cohort and the performance of the cohort, i.e. how many in the cohort eventually reached a certain Stage.
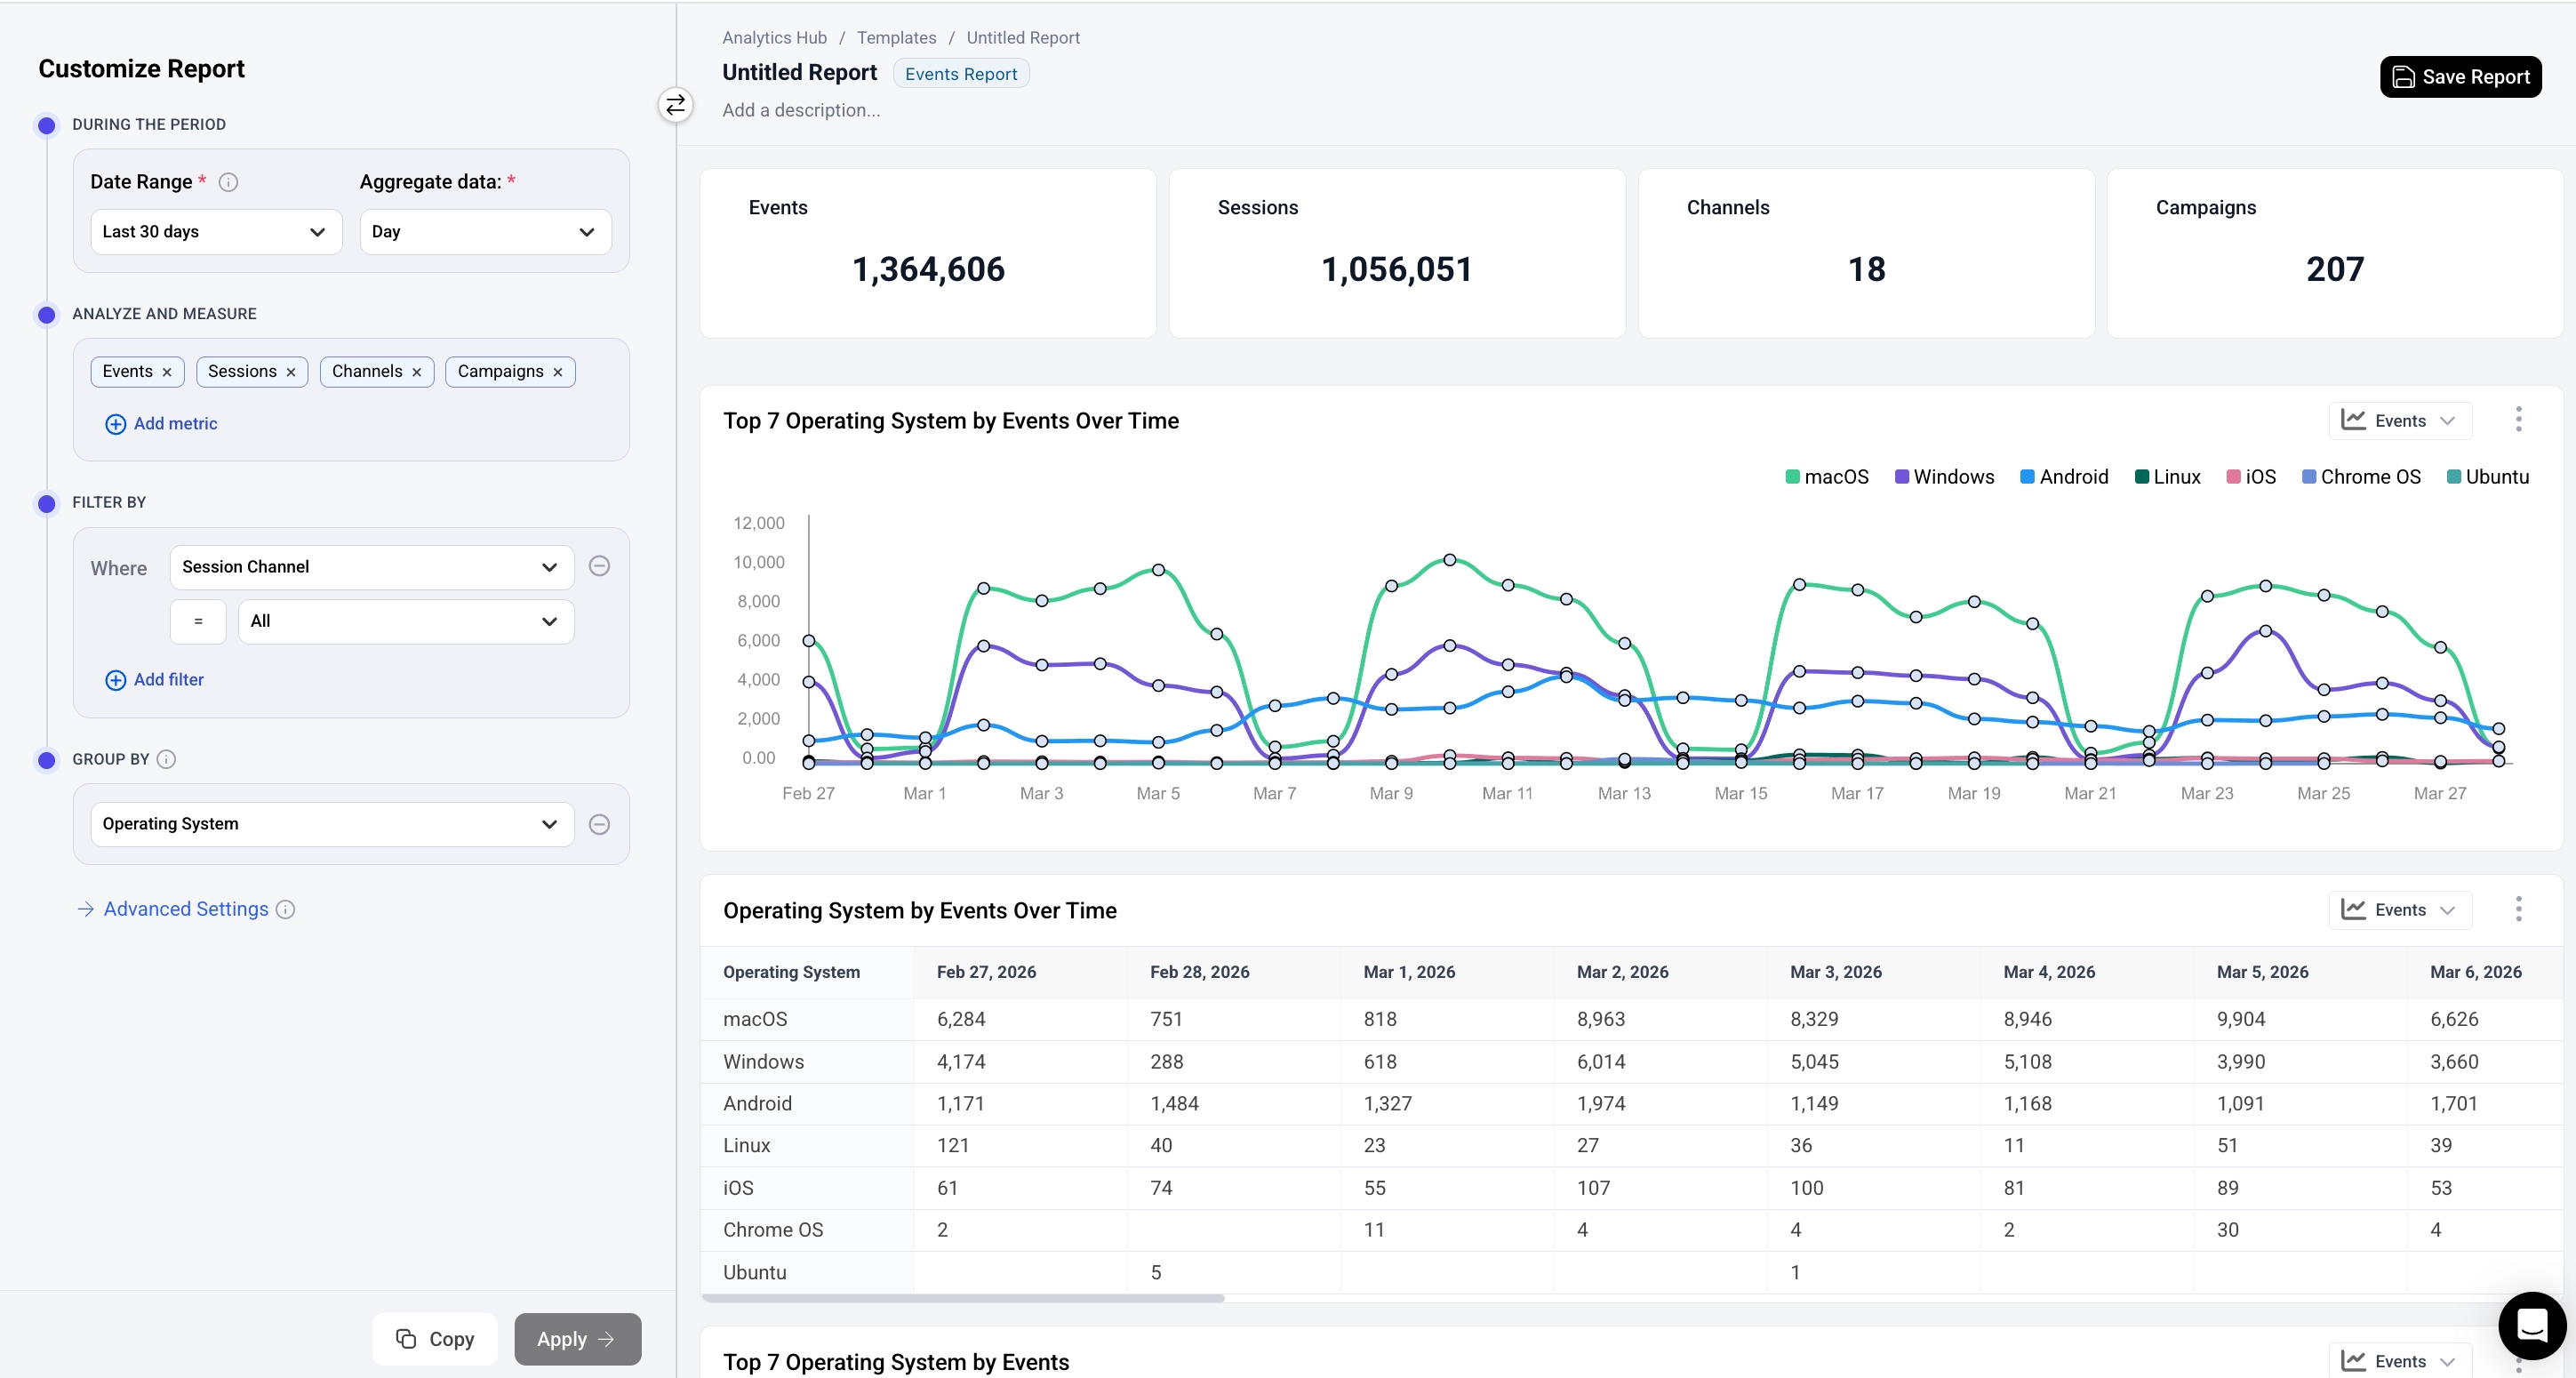
Key metrics: Event Count, Unique Users, Event Frequency, Conversion to Stage
Use cases:
- Track button clicks, form submissions, and page views
- Measure feature adoption and engagement
- Identify drop-off points in user journeys
- Compare event patterns across segments
Configurator note: No stage model is required. The metrics section is labeled "Analyze and Measure."
Analyze Performance
This report type allows you to assess acquisition performance using session data. It measures how channels, sources, and campaigns drive leads, prospects, and deals — helping you understand what influences pipeline creation and apply attribution models for a complete view of performance.
This report type behaves like a cohort analysis where date and filters define the cohort you are analyzing. The cohort can be defined by specific session characteristics like the channel, source or campaign and specific user and company properties.
The metrics describe the cohort and the performance of the cohort - how many of the cohort later reached a certain Stage. This can be combined with a specific attribution model to better define how you want to measure performance.
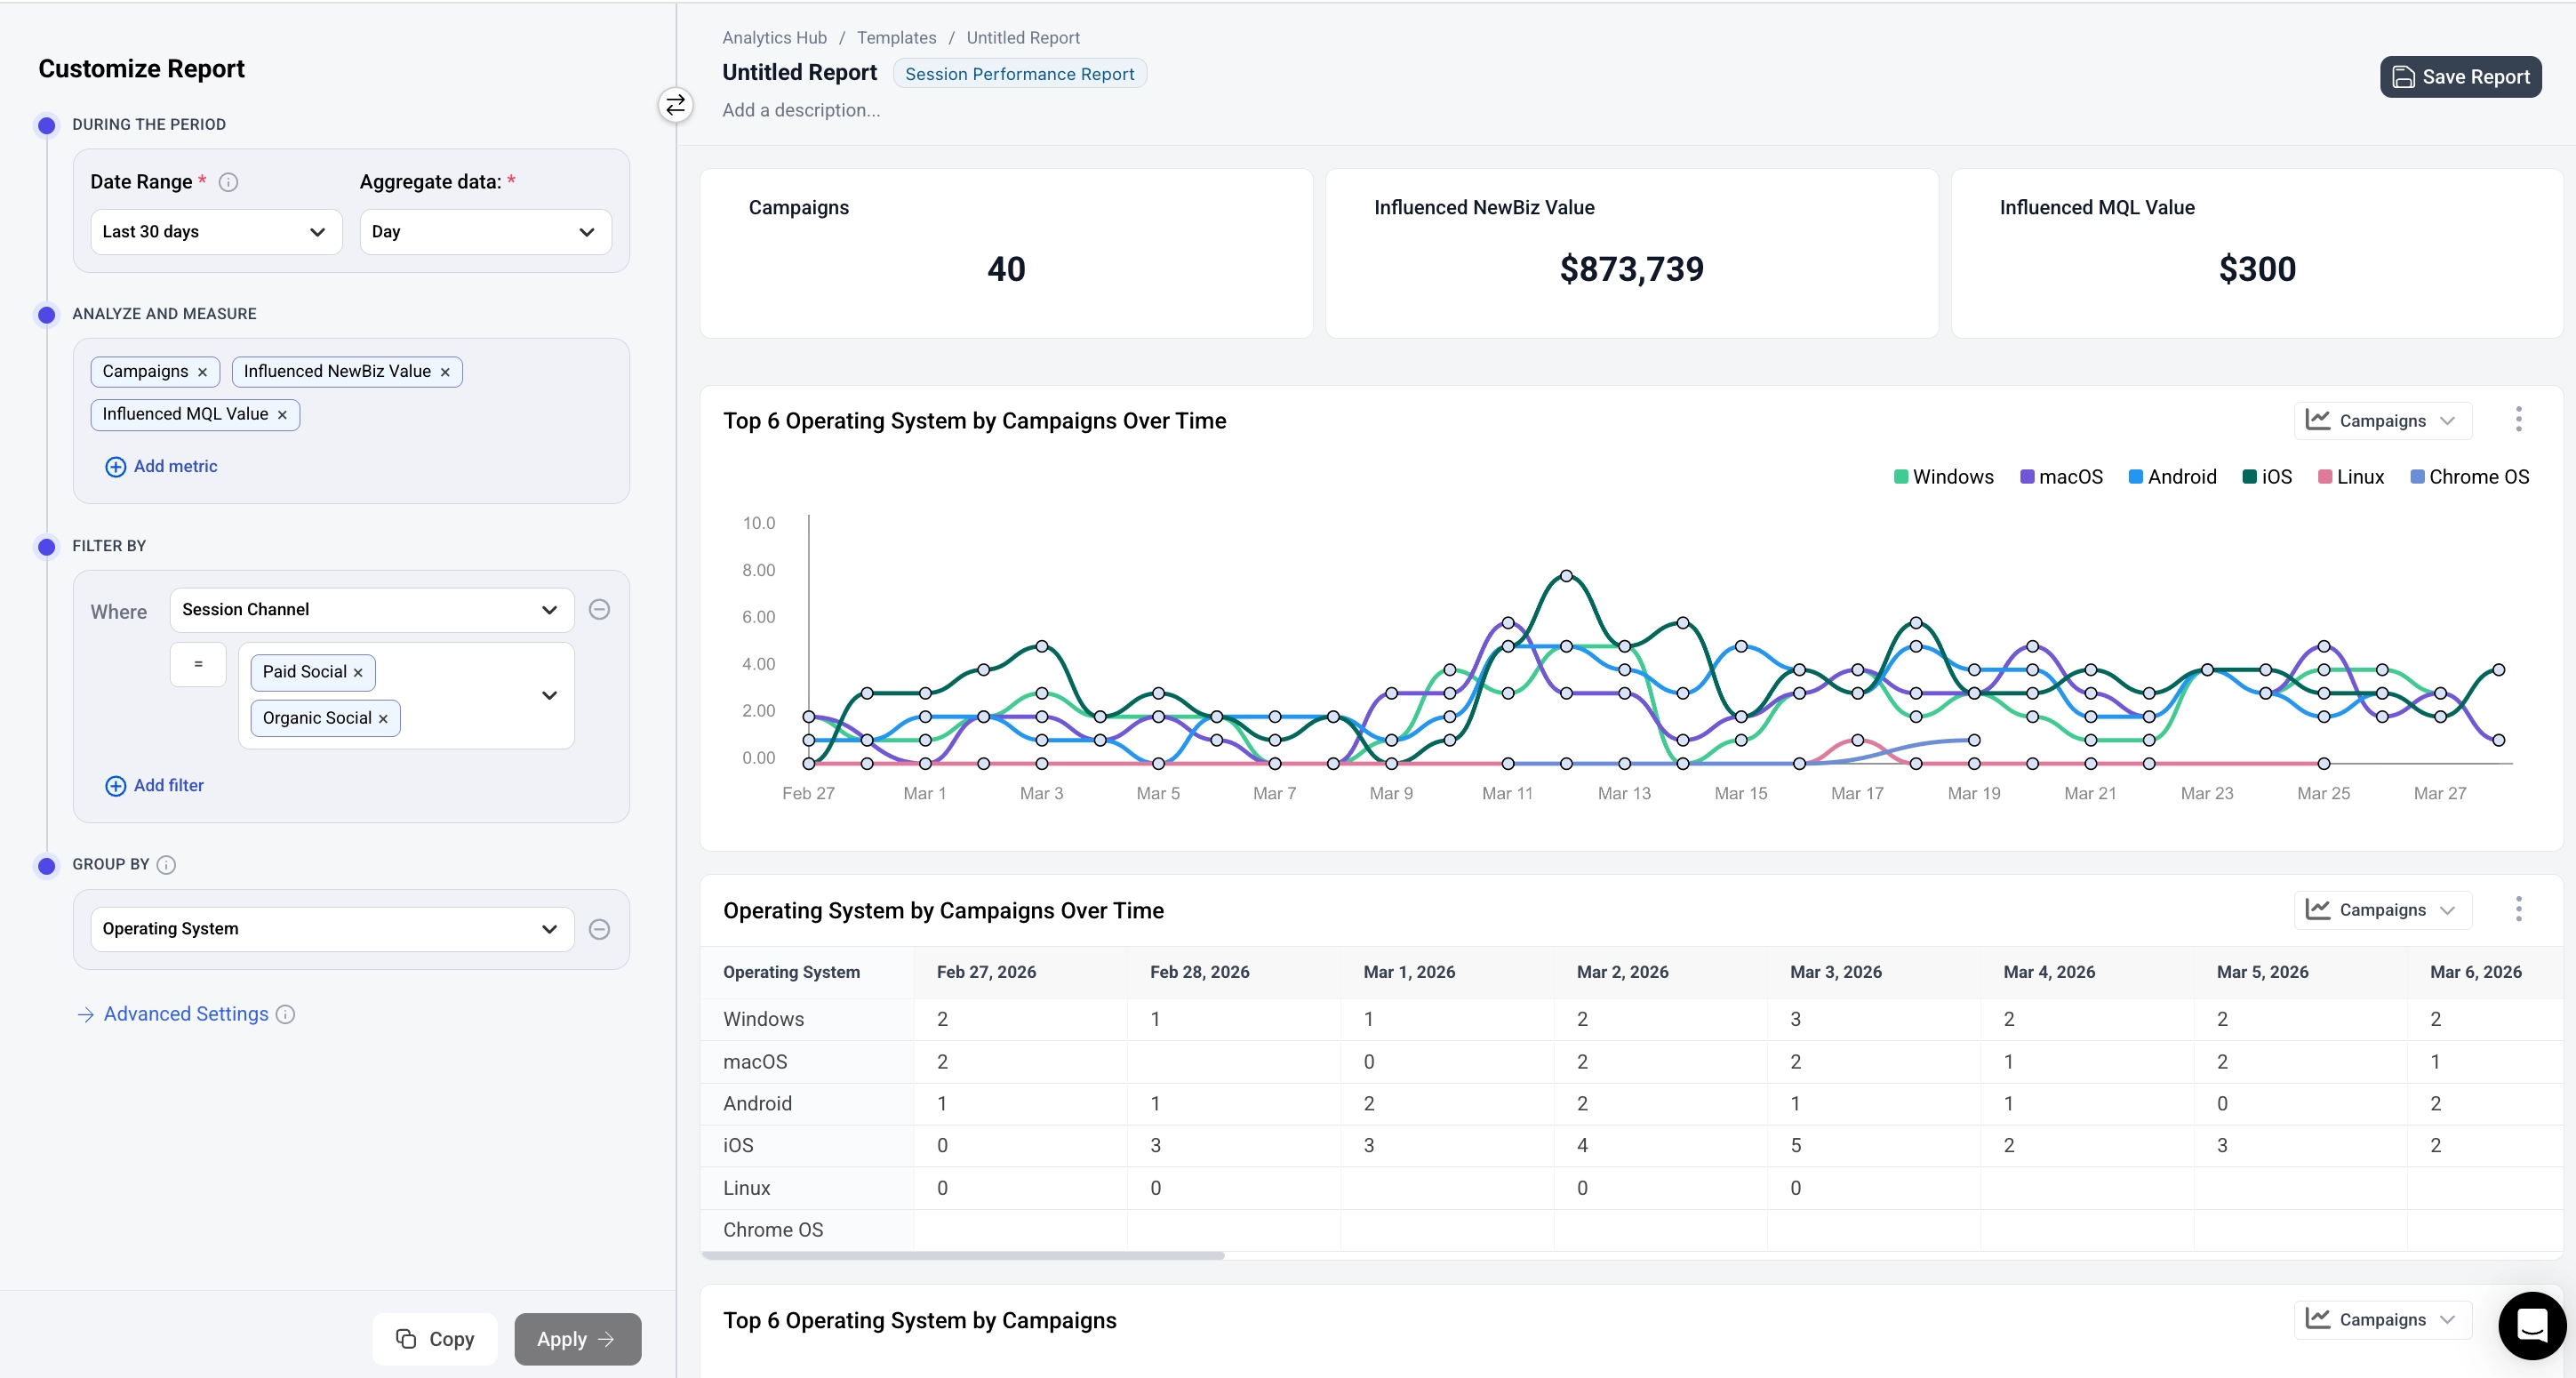
Key metrics: Deals Influenced, Deals Count, Influenced and Attributed Stages and Stage values
Use cases:
- Identify top-performing marketing channels
- Measure campaign effectiveness
- Optimize marketing budget allocation
- Track organic vs. paid acquisition trends
Configurator note: No stage model is required.
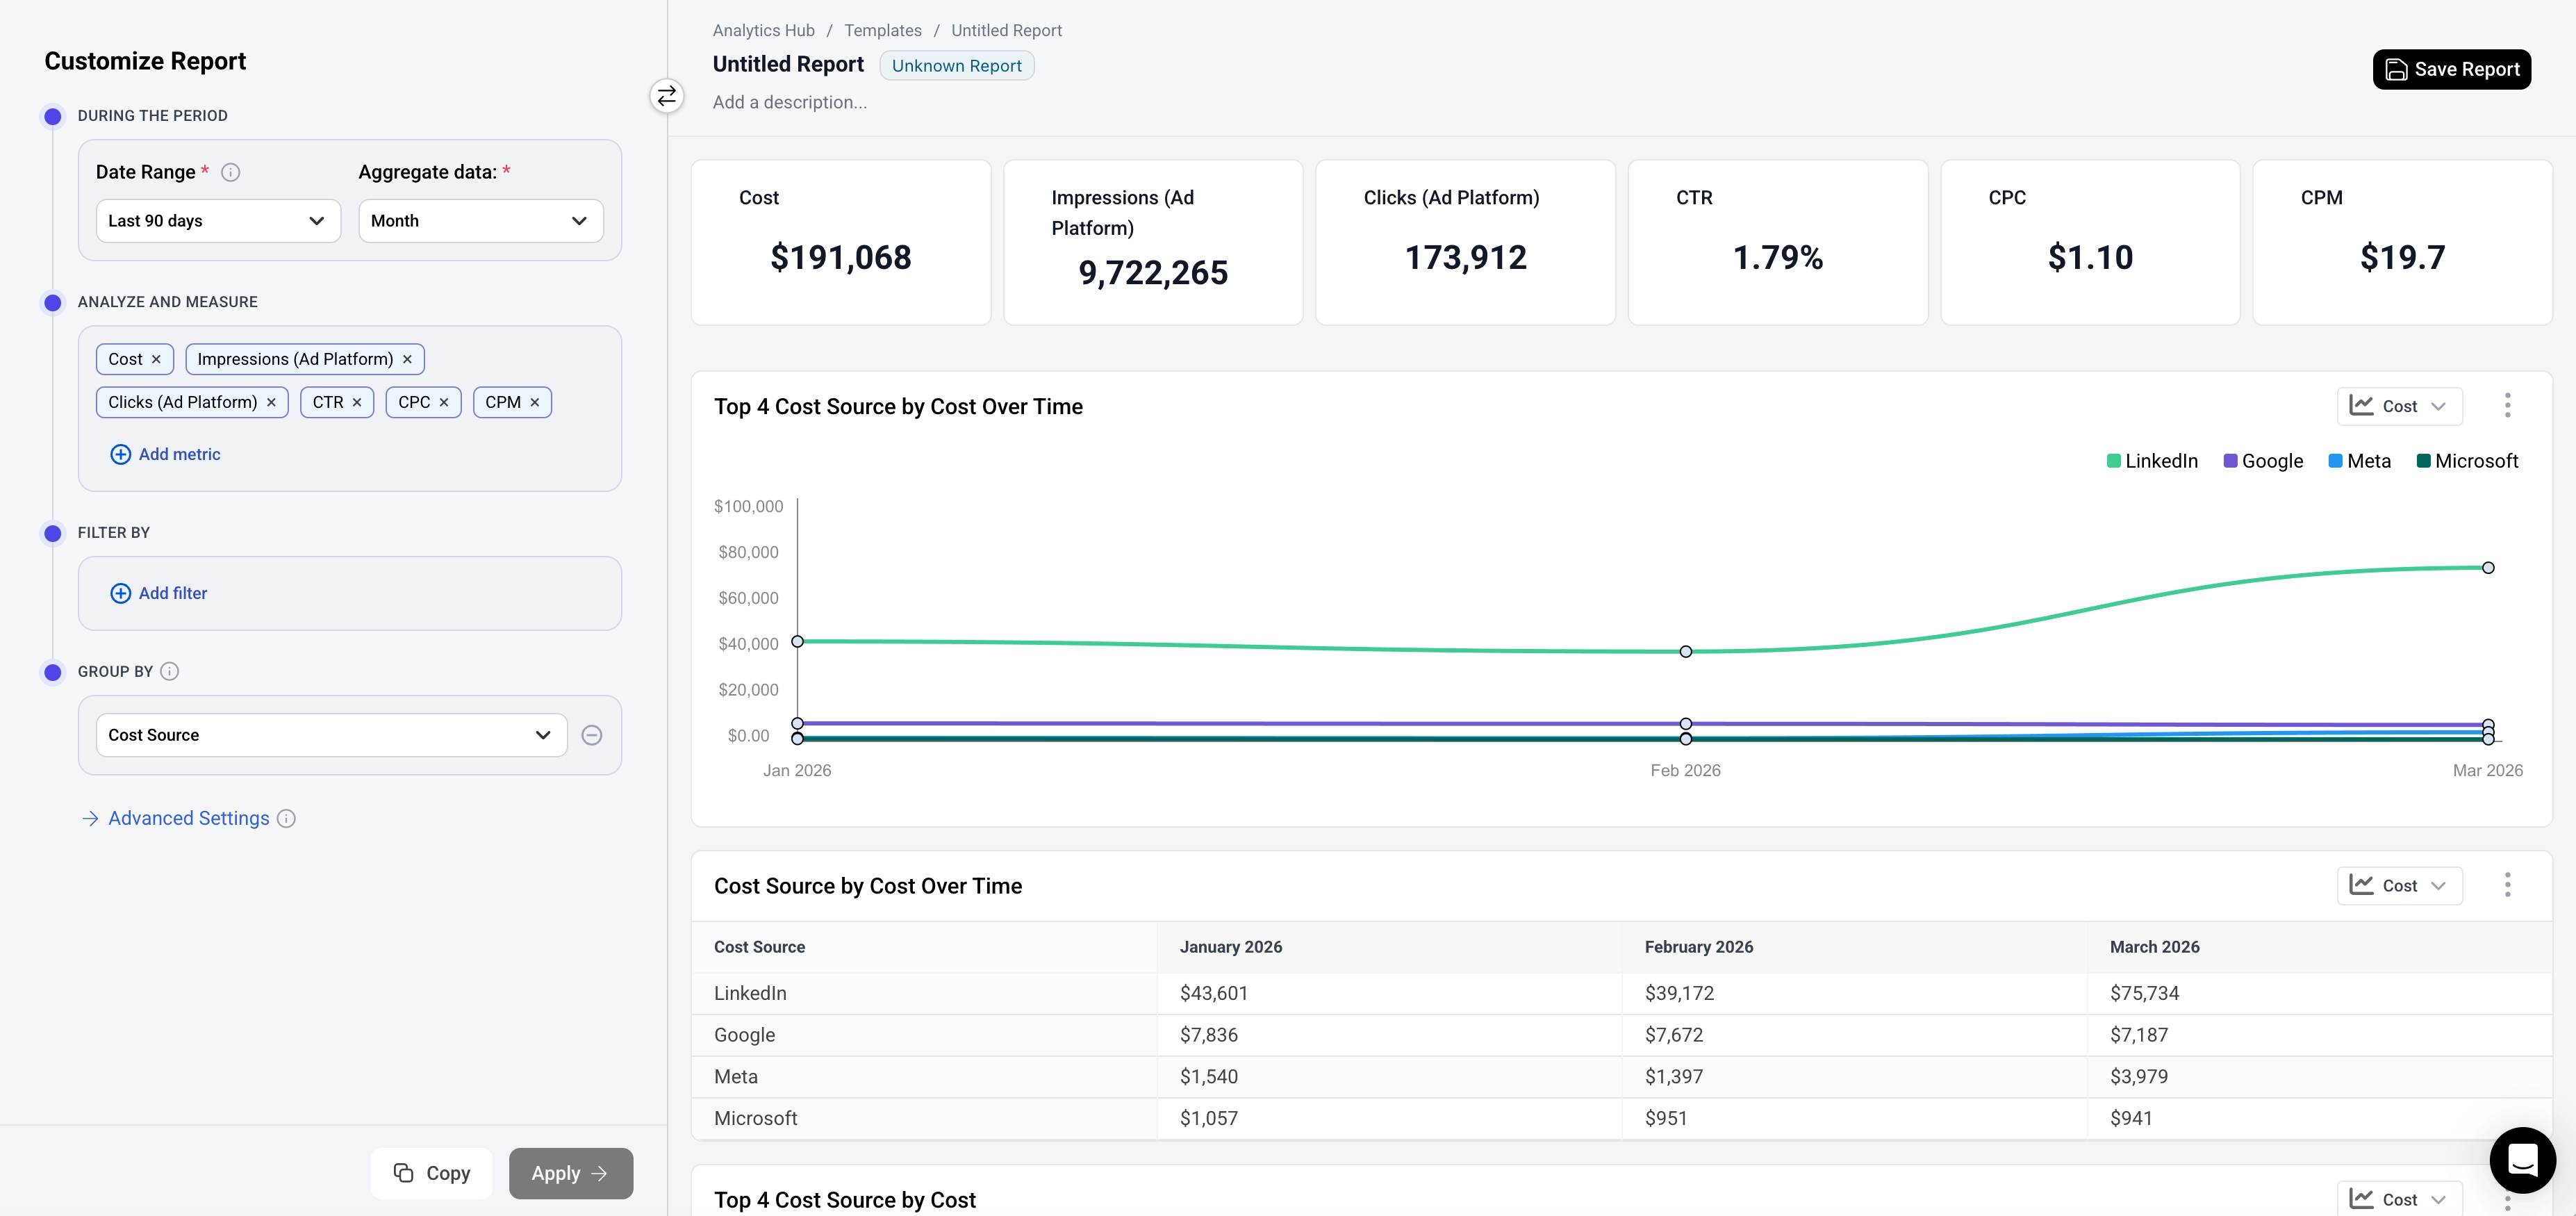
Paid Performance
This report type helps you monitor and optimize advertising spend across platforms. It lets you compare cost efficiency between campaigns, spot underperforming ads, and forecast budgets.
Paid Performance reports behave like a cohort analysis where date and filters define the spend/cost period you are analyzing. The cohort can be defined by specific characteristics of the spend such as ad network, campaign or spend type.
The metrics describe the cohort and the performance of the cohort - how many of the cohort later reached a certain Stage. This can be combined with a specific attribution model to achieve a ROAS or ROI type of analysis.
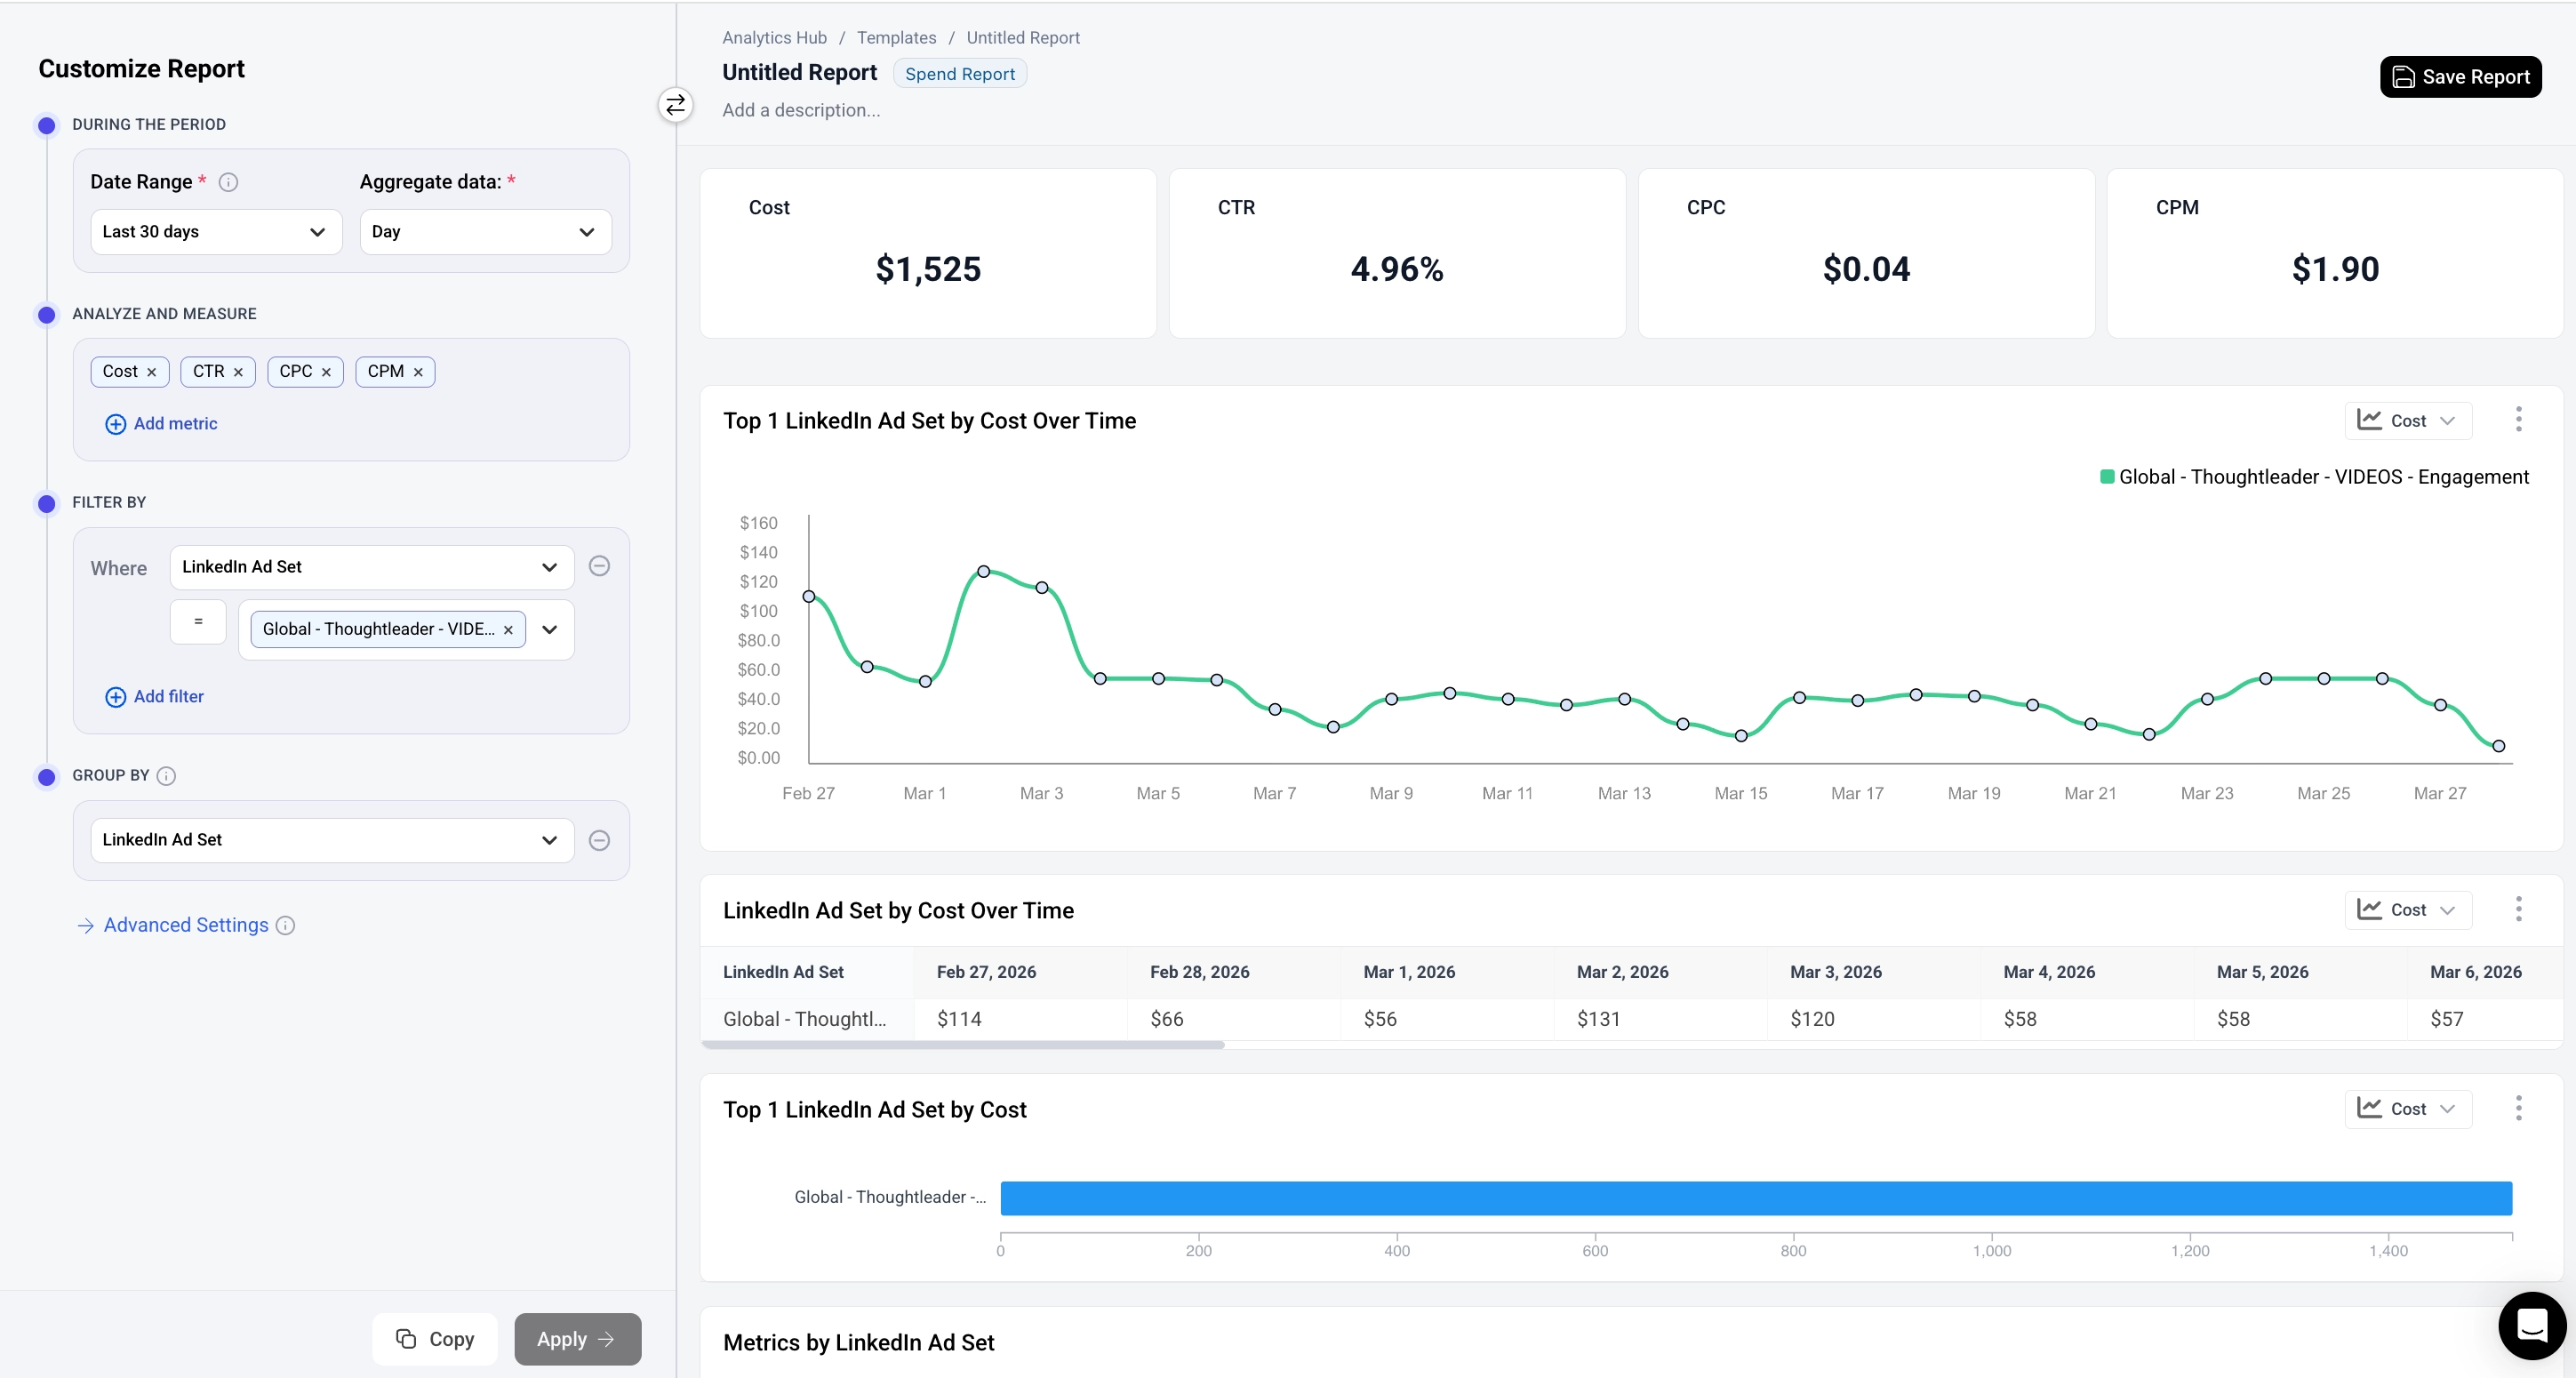
Key metrics: Cost, Impressions, Visitors, Contacts, Companies, CTR, CPC, CPM, CPA, ROI, Influenced and Attributed Stages and Stage values
Use cases:
- Compare cost efficiency between campaigns
- Identify overspending or underperforming ads
- Forecast and plan marketing budgets
Configurator note: No stage model is required.
Spend Summary
This report type helps you monitor and optimize advertising spend across platforms. The metrics describe performance from various platforms in a single place for easy comparison.
Key metrics: Cost, Impressions, CTR, CPC, CPM, CPA
Use cases:
- Track advertising costs across platforms
- Forecast and plan marketing budgets
Configurator note: No stage model is required.
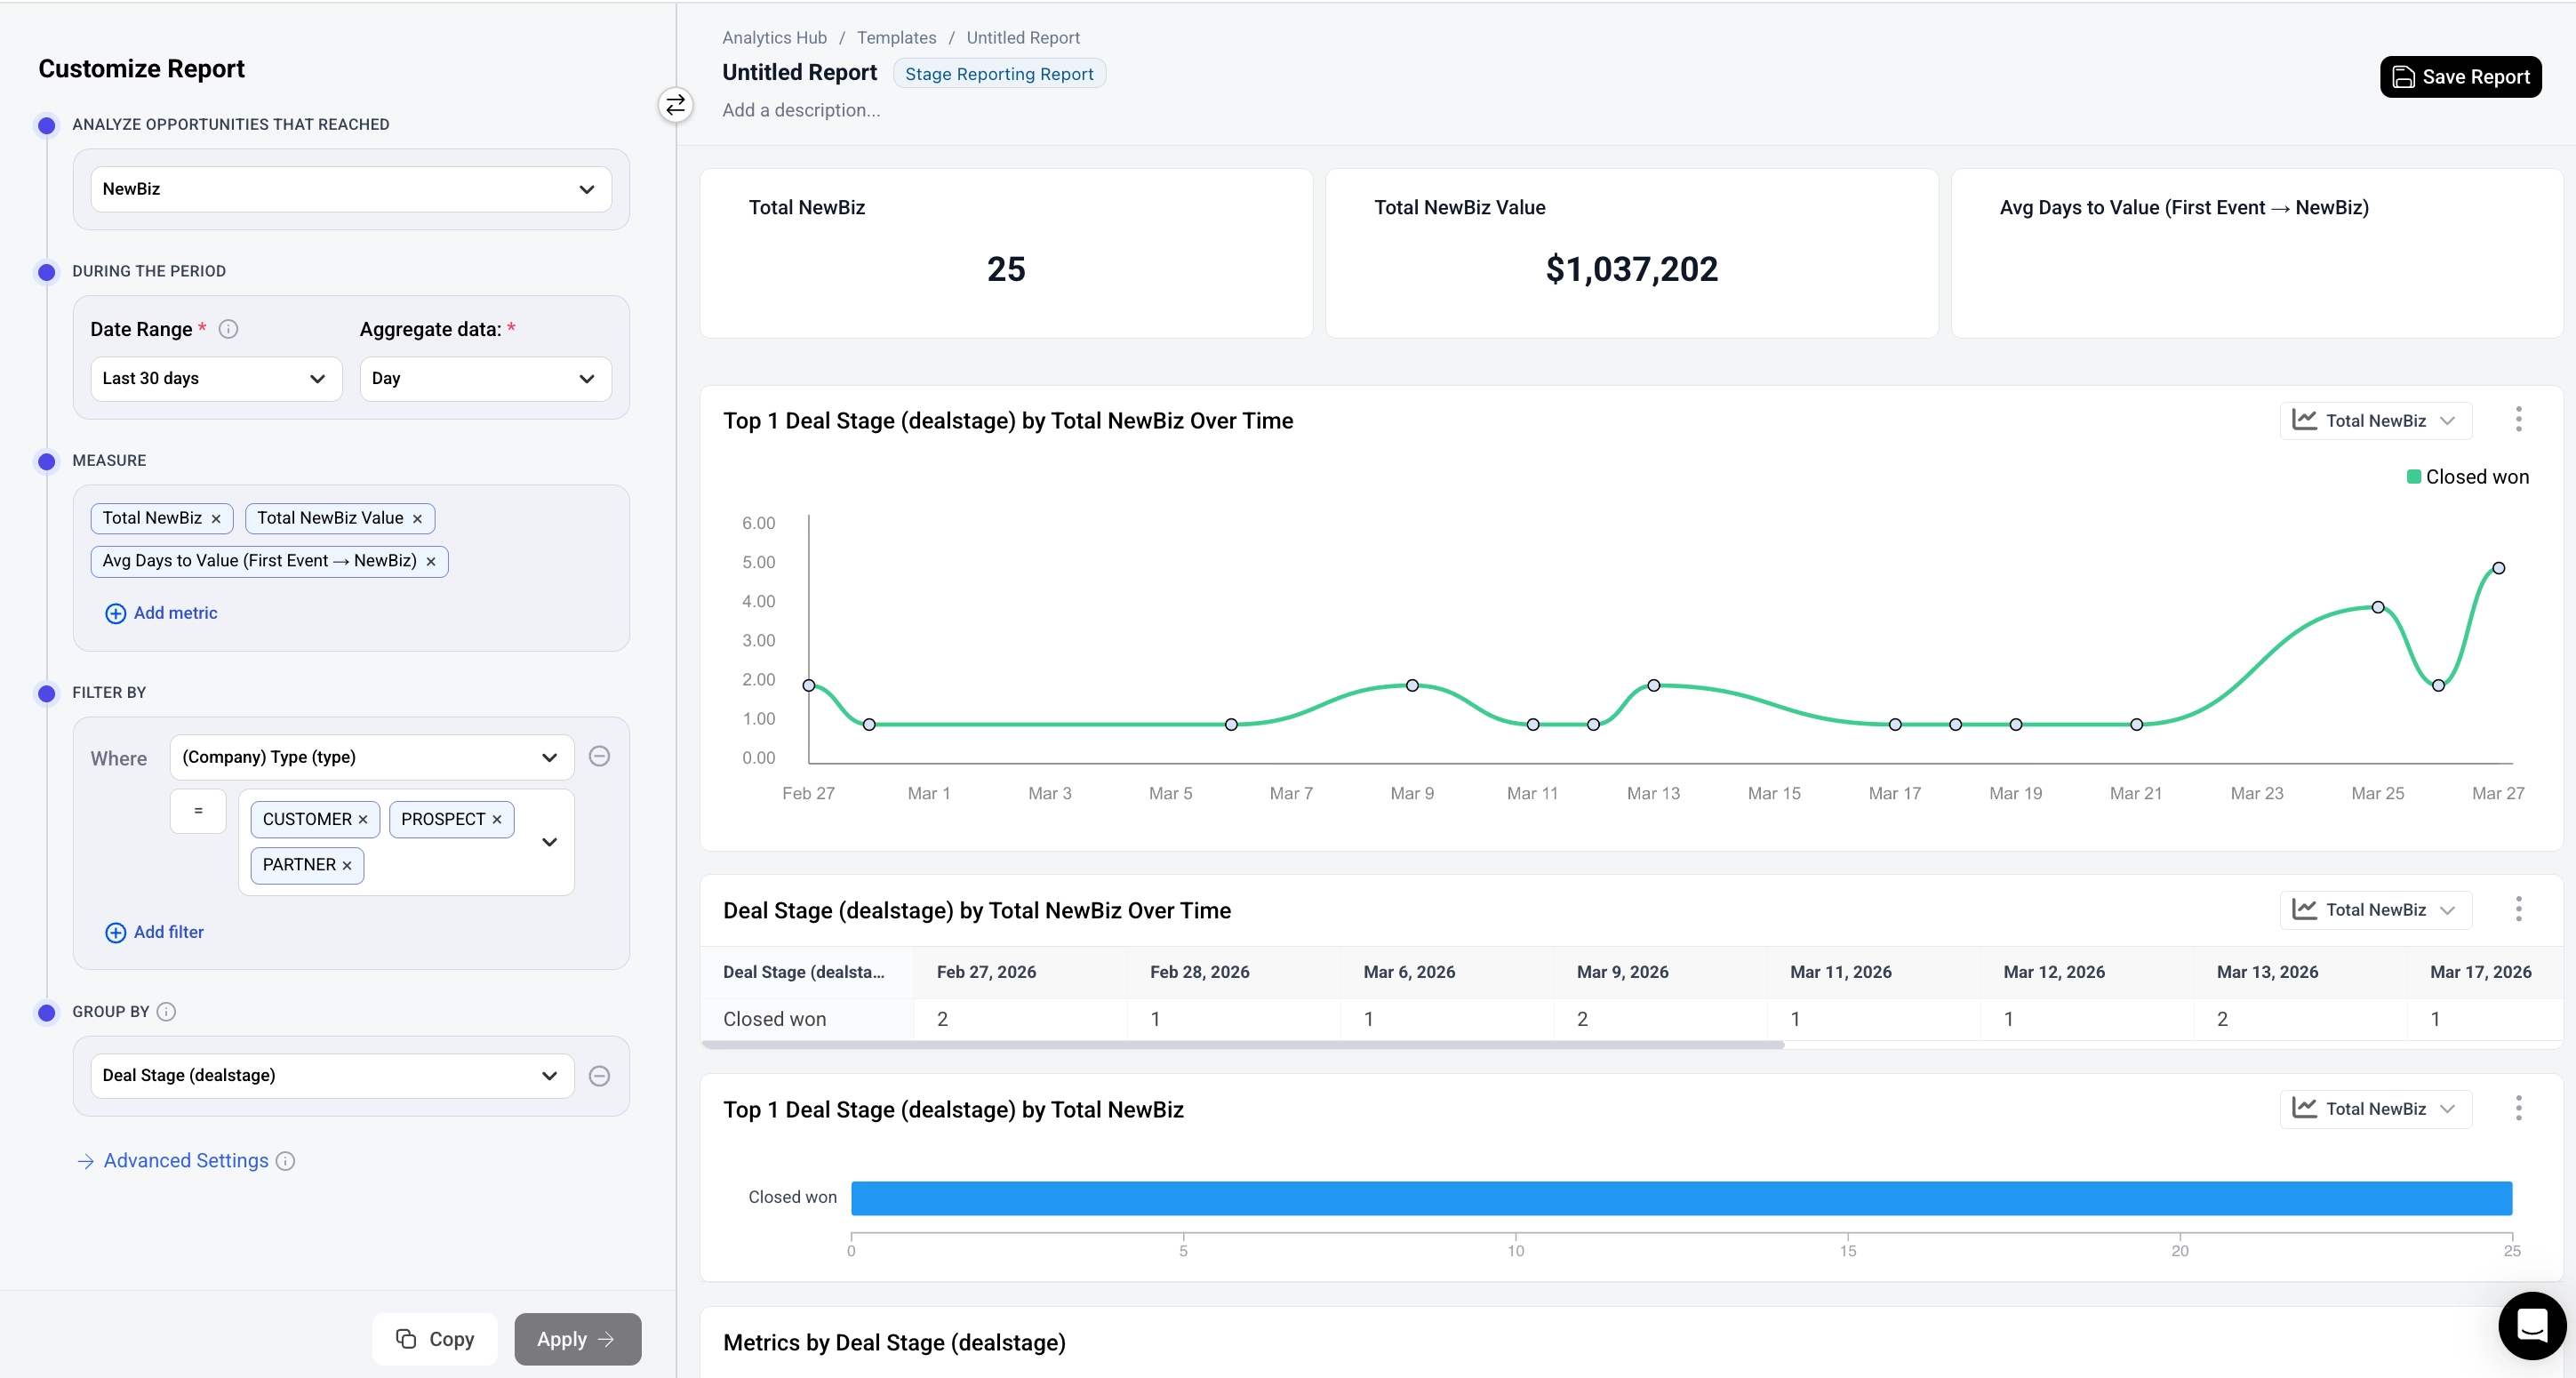
Single-Stage Reporting
This report type lets you analyze how many deals or leads reached a pipeline stage. You can split the deals by segments and understand how long they took to reach the stage you chose.
Single-Stage Reporting reports focus on Deals or Leads that reach a specific Stage during a period of time and enables description through segmentation. Reports of this type require you to select both a stage and a time period.
Key metrics: Deals/Leads, Value of Deals/Leads, Average Channels, Touches, Contacts to reach the selected Stage
Use cases:
- Understand your pipeline performance
- Identify which customer segments — industry, region, company size, deal size, and more — drive the most value.
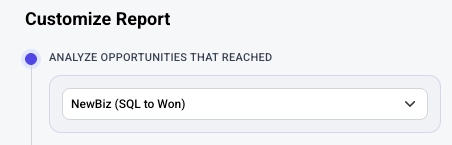
Configurator note: You must select a stage model before configuring the rest of the report. The configurator shows an "Analyze Opportunities That Reached" dropdown at the top where you choose the stage model (e.g., "NewBiz (SQL to Won)"). The metrics section is labeled "Measure."
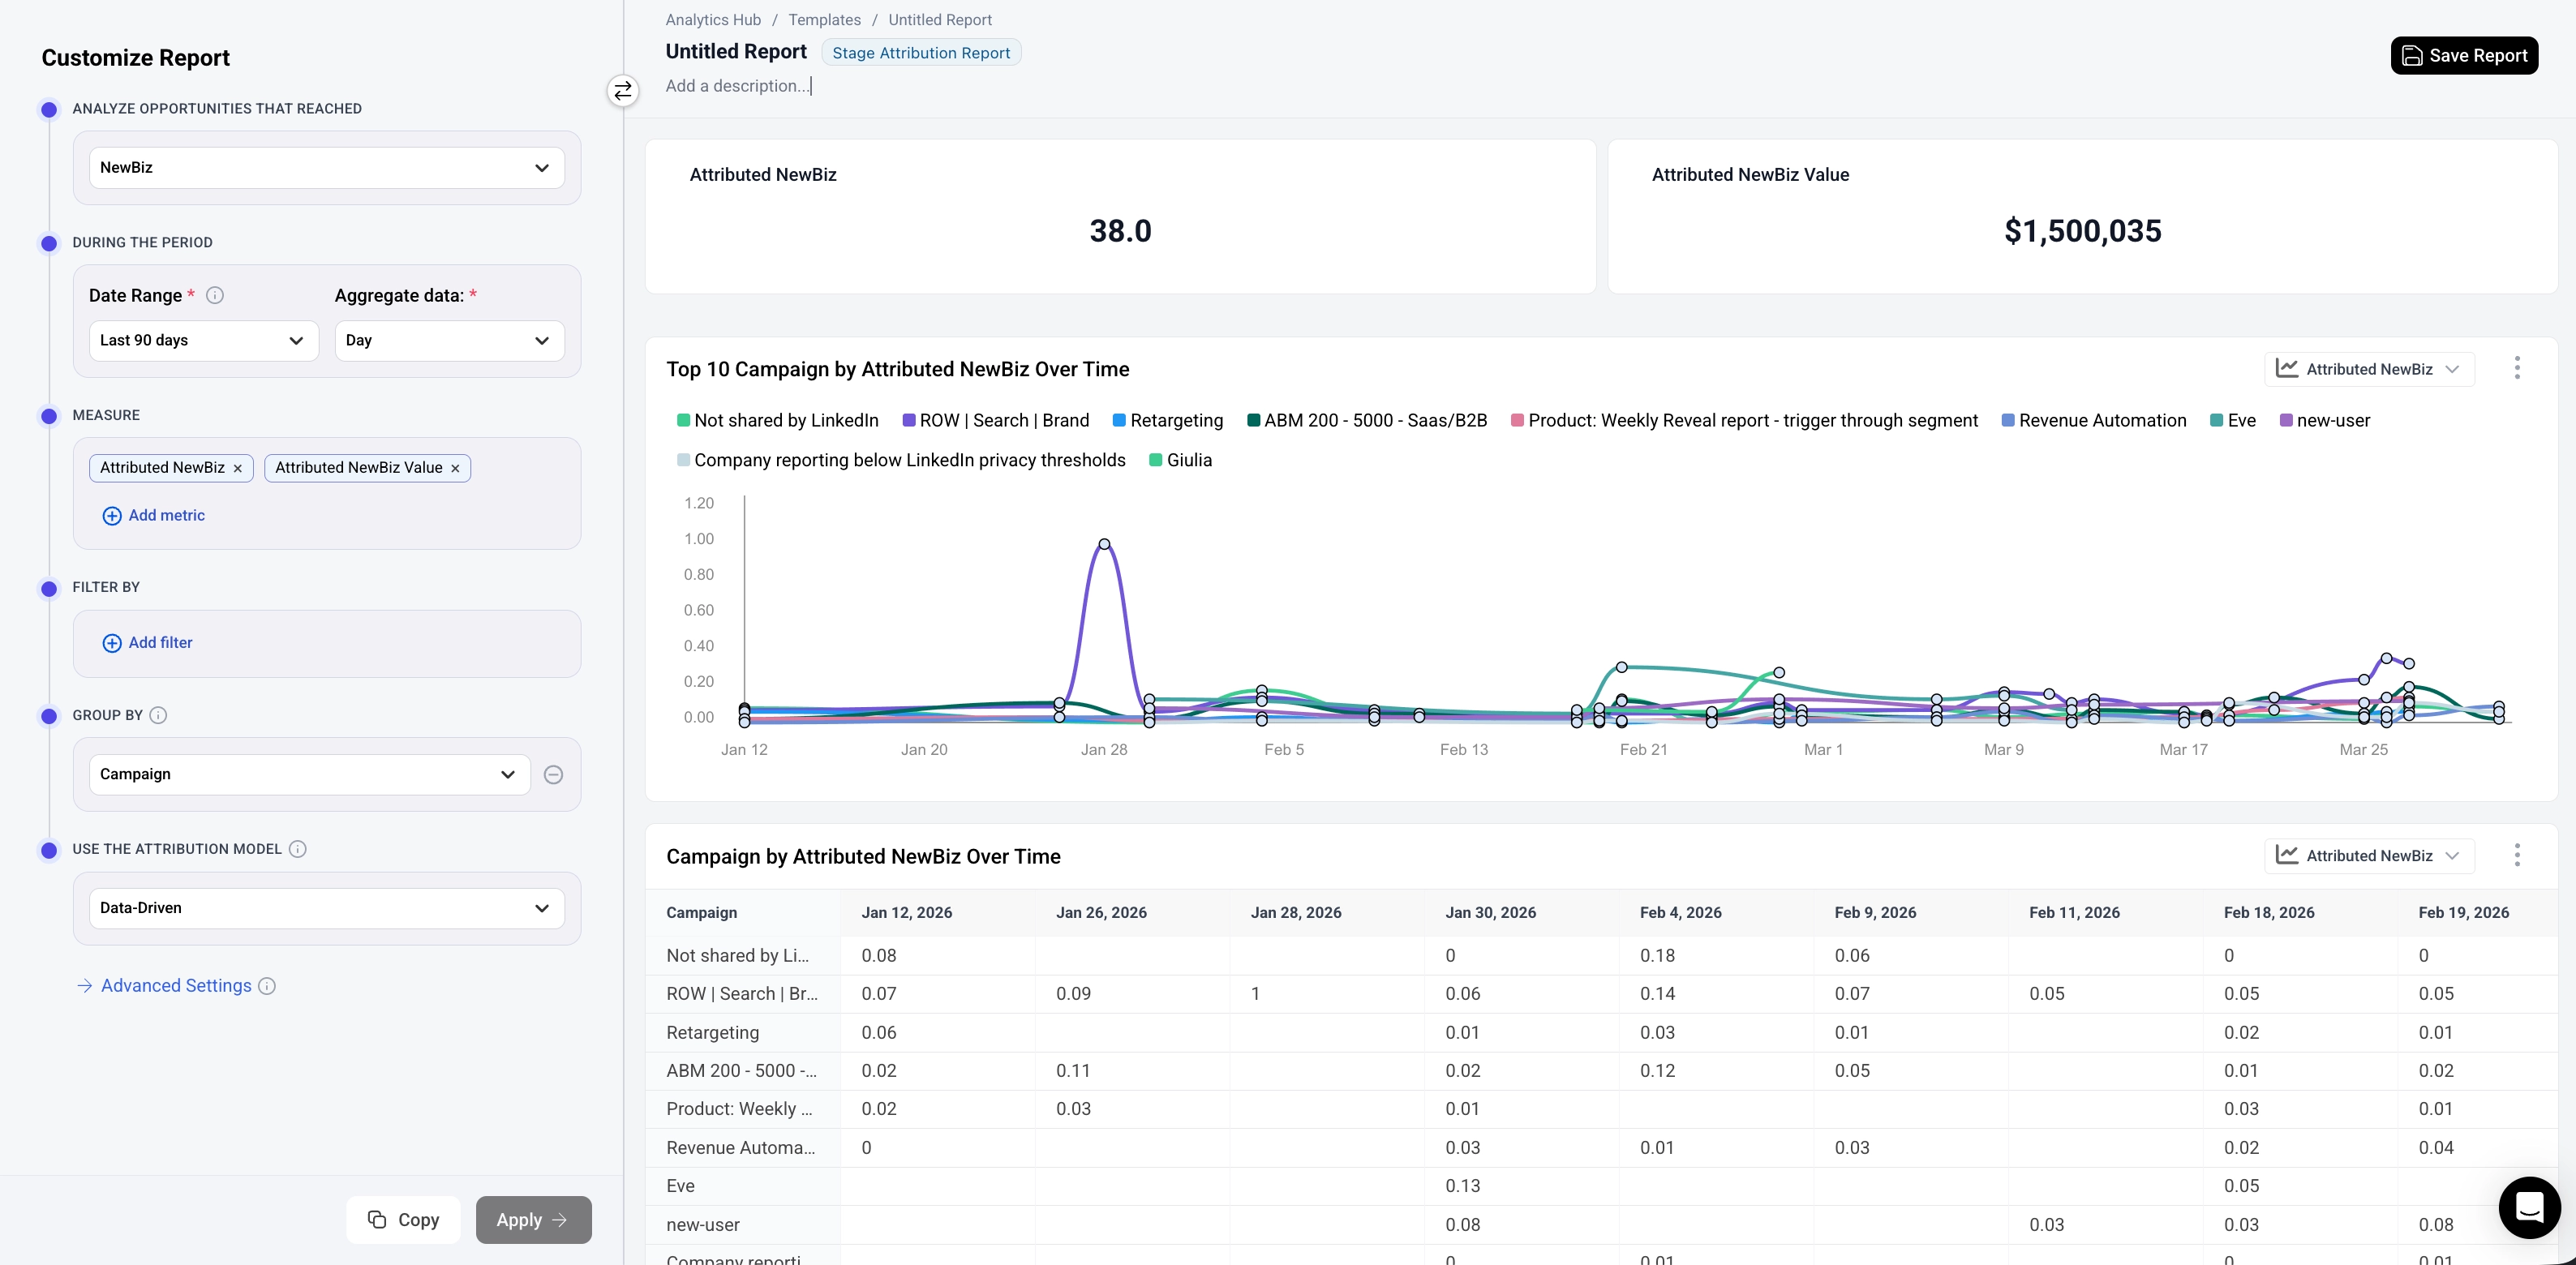
Analyze Stage Attribution
For deals or leads that reached a selected pipeline stage in a given period, this report type lets you see how value is distributed across the associated marketing touchpoints — by channel, source, campaign, and more.
Analyze Stage Attribution reports focus on deals or leads that reached a specific stage in a period and describes where they came from using Attribution. Reports of this type require you to select a Stage, an Attribution Model, and a Time Period.
Attributed (default): Deal value is split across the associated touchpoints according to the chosen attribution model — data-driven, linear, W-shaped, etc. Each deal's total value always sums to 100%, so there's no double counting.
Influenced: Instead of splitting value, each touchpoint channel or campaign gets full credit for any deal it was associated with. The same deal can be counted multiple times across different channels.
Key metrics: Attributed Deals/Leads, Attributed value of Deals/Leads
Use cases:
- Where did my deals and leads come from?
- See which channels and campaigns get attributed credit for deals reaching each pipeline stage
- Compare attributed value and deal count across channels, sources, and campaigns
- Understand how credit is distributed across touchpoints using different attribution models (first touch, linear, W-shaped, etc.)
- Report on marketing’s impact on the entire funnel and be accountable for business outcomes
Configurator note: You must select a stage model before configuring the rest of the report, similar to Single-Stage Reporting. The metrics section is labeled "Measure."
Stage Model vs. No Stage Model
The six report types fall into two categories, which each have their own requirements.
Category | Report Types | Stage Model Required? |
Cohort analysis | Analyze Engagement, Analyze Performance, Paid Performance, Spend Summary | No |
Stage-based analysis | Single-Stage Reporting, Analyze Stage Attribution | Yes |
For stage-based report types, the stage model determines which pipeline stages are included in the analysis. You select the stage model from the "Analyze Opportunities That Reached" dropdown at the top of the configurator.
This must be set before you can add metrics and configure the rest of the report.
For more details on configuring reports, see the Configurator guide.