Microsoft Ads
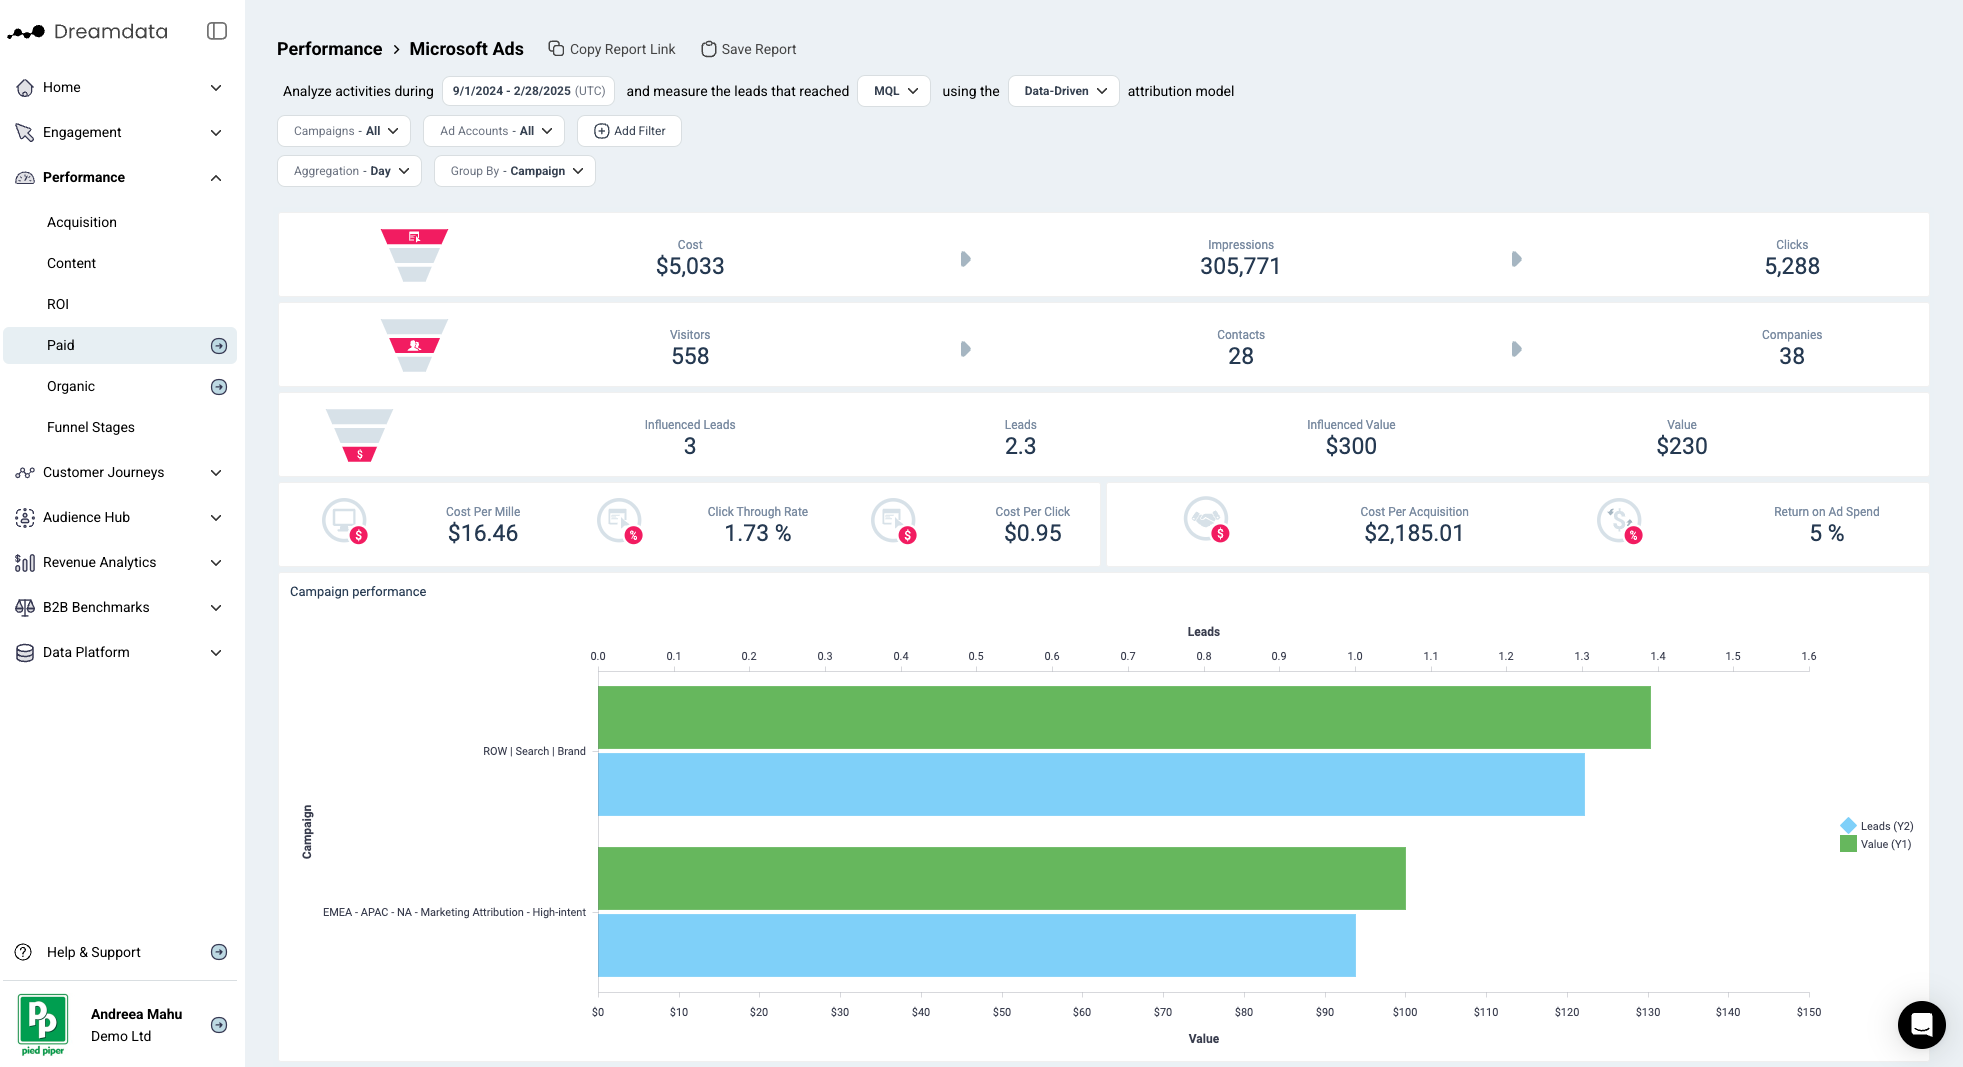
With this dashboard, we give users all the information you need to understand how your Microsoft Ads are performing. From the overall funnel, down to each campaign and its return on ad spend. You get the full perspective on your campaigns, which then will help you to make data supported decisions and strategies.
Filters
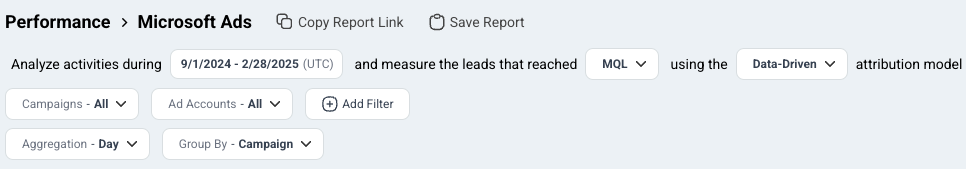
Date range: Set the time period you want to investigate
Stage reached: You can select your preferred pipeline stage. Read more about the Free Tier Stages here
Attribution model: Choose the attribution model which is meaningful for your analysis
- First Touch
- Last Touch
- Linear
- U-Shaped
- W-Shaped
- Data-Driven
Campaigns: Choose the campaign you want to investigate
Ad Accounts: Choose the ad account/s you are interested in
Aggregation: Set the time frames you wish to display your data in
Group By: Choose your preferred option
- Campaign
- Ad Account
Metrics
Cost: The total spend on Microsoft Ads
Impressions: The number of times your Bring ads are shown. Each time your ad appears on someone's feed it is counted as an impression.
Clicks: The total amount of clicks recorded by Microsoft Ads
Visitors: The number of unique users who had a website session which originated from Microsoft Ads during the given time period
Contacts: The number of visitors who we have been able to attach an email to their user id
Companies: The number of companies who are attached to Contacts, or the number of companies in your CRM who we can be attached to any visitor traffic (anonymous)
Deals: The number of deals that are associated with Microsoft campaigns based on your selected filter
Value: The amount of revenue that is attributed to the Microsoft campaigns based on your selected filter
Cost Per Mille (cpm): Cost per thousand. This calculation is used to denote the price over one thousand impressions
Click Through Rate (ctr): Clicks divided by Impressions
Cost Per Click (cpc): Total Cost divided by Clicks
Cost Per Acquisition (cpa): Total Cost divided by Attributable Deals
Return on Ad Spend (ROAS): Total Attributable Revenue divided by Total Cost
Funnel Overview
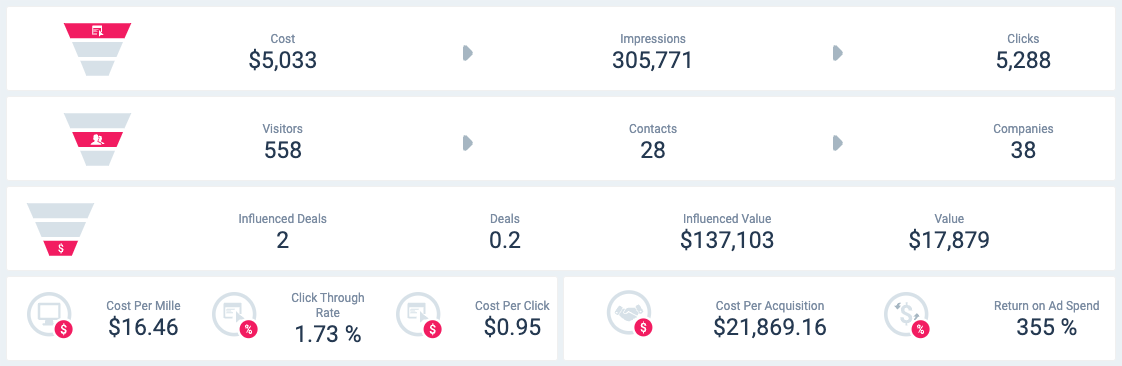
Cost → Clicks
In this first section, we provide the top of the funnel for your Microsoft Ads for the given time period. This data is pulled directly from Microsoft Ads through our integrations.
Visitors → Contacts → Companies
In the next section, we give an overview of the traffic from Microsoft Ads which is based on the Tracking script we have on your websites.
Deals → Value
In the third section, we provide the total number of Attributable Deals and Attributable Value (revenue) that can be assigned to Microsoft Ads based on the filters selected.
To calculate these numbers, we first look at the pool of contacts/companies that visited a Microsoft Ad based on the dates/filters. Once we have that group, we see what deals were closed after their visit, up to today's date. More importantly, we are only looking at deals where we have a recorded history of sessions; Attributable Deals. This pool of attributable deals will make up the basis for this section. For each of these deals and all their sessions, we will run the Attribution Model you have selected so each session is given a deal and revenue amount.
For both Attributable Deal and Value (revenue), we then provide the sum of these amounts for each session that contains a Microsoft Ad, depending on which Attribution Model you have selected.
Note: When using First Touch/Last Touch you will get a rounded deal number, as a deal is either First Touch Paid or Not. While with Linear, W-Shaped or U-Shaped you will get a fraction of a deal as most Paid Touchpoints will make up a fraction of the sessions on a deal.
Average Position → Cost per Click → Cost per Acquisition → ROAS
On the fourth row, we provide percentages for some common KPIs, most importantly Return on Ad Spend.
Graphs and Tables
Campaign Performance
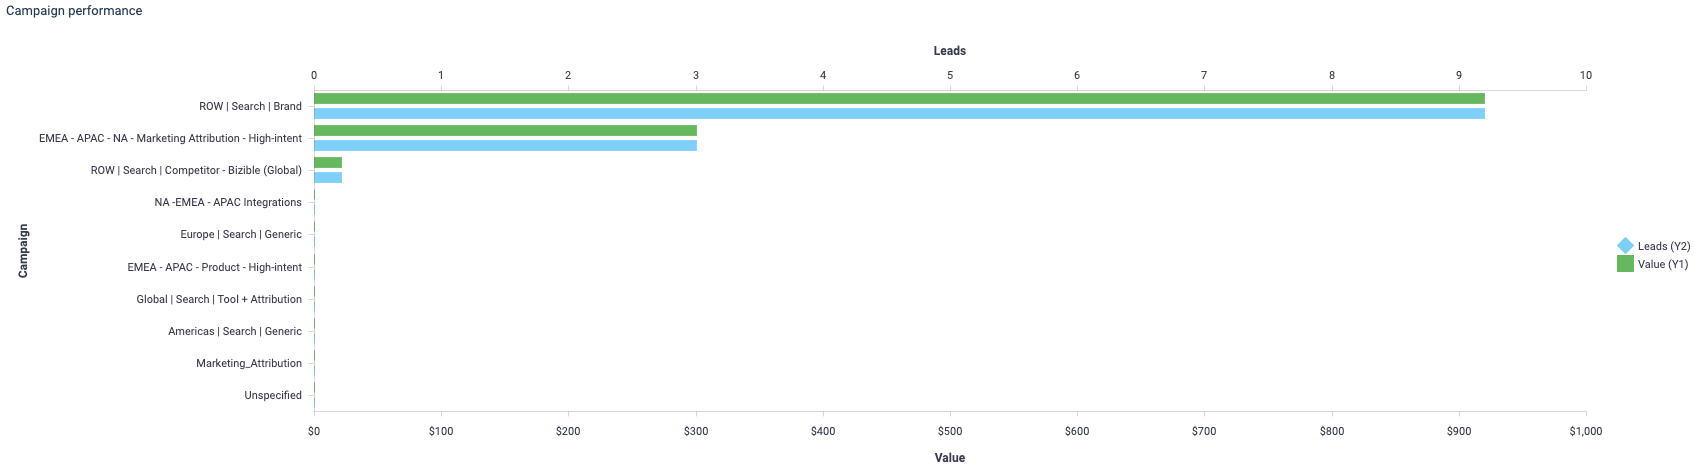
In this table, we list each Microsoft Ad Campaign and their performances (metrics) for the time frame specified by the Date and Aggregate Filter. This will allow you to compare each Campaign in detail, but also compare the performances for specific and detailed timeframes. Filter each column to display the highest/lowest numbers on the top.
Campaign Performance over Time
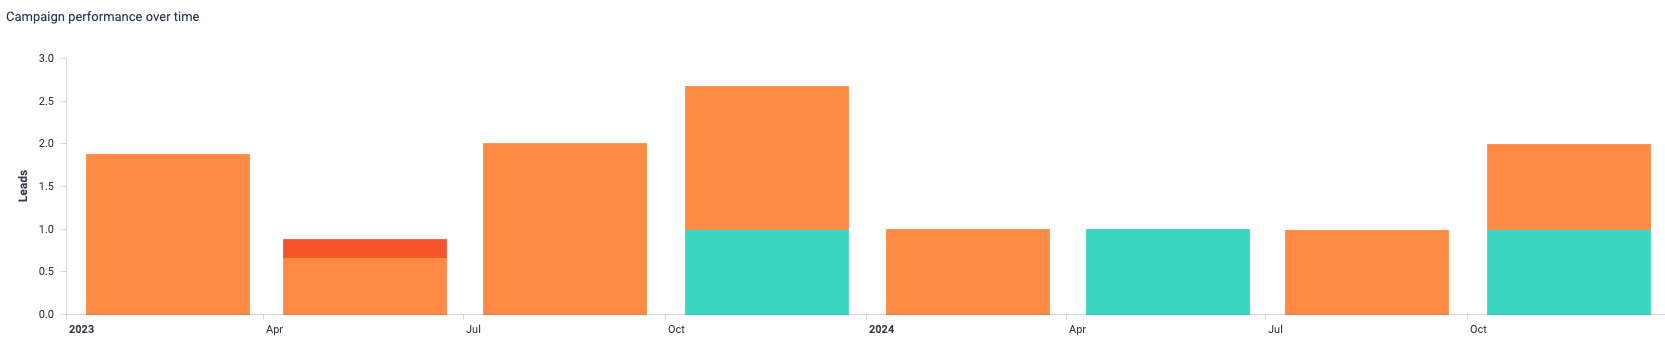
We then provide a graph showing the development of your Microsoft Ad Campaigns and their generated deals over the period of time specified in your Filters. Use the Aggregate filter to breakdown the X-Axis as you wish e.g. (day, week, month).
This graph makes it easy to see which Campaign is performing best, but also it shows how long it generally takes for a campaign to win the deals. To do that, select a specific Campaign and set the Aggregation Filter by days. This will allow you to get detailed analysis on unique campaigns.
Note: time frame is key so you can give enough time to your campaigns to create value.
Campaign
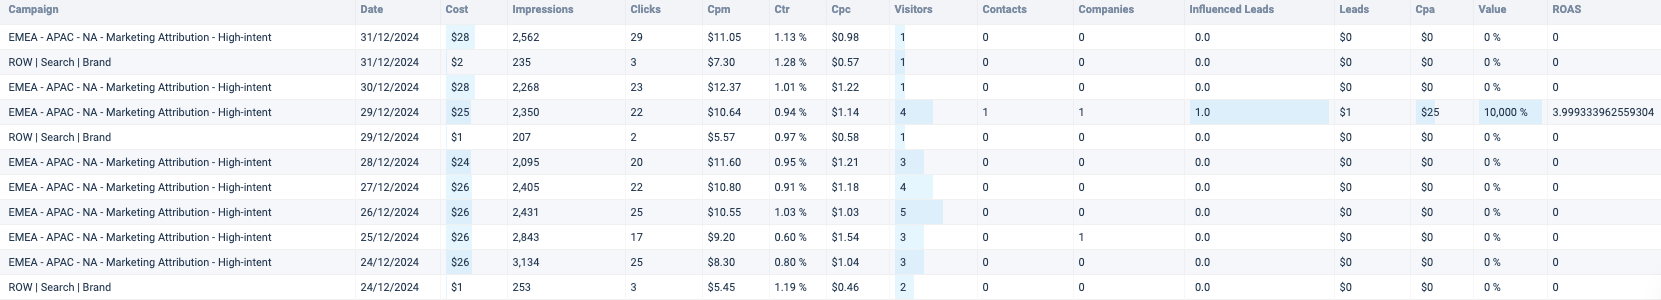
In this table, you will get more in depth data on your Microsoft Ads campaigns. These campaigns are broken down into: different timestamps, cost, impressions, and more. This information helps to evaluate the business outcomes generated through the Microsoft Ad platform.