Google Search
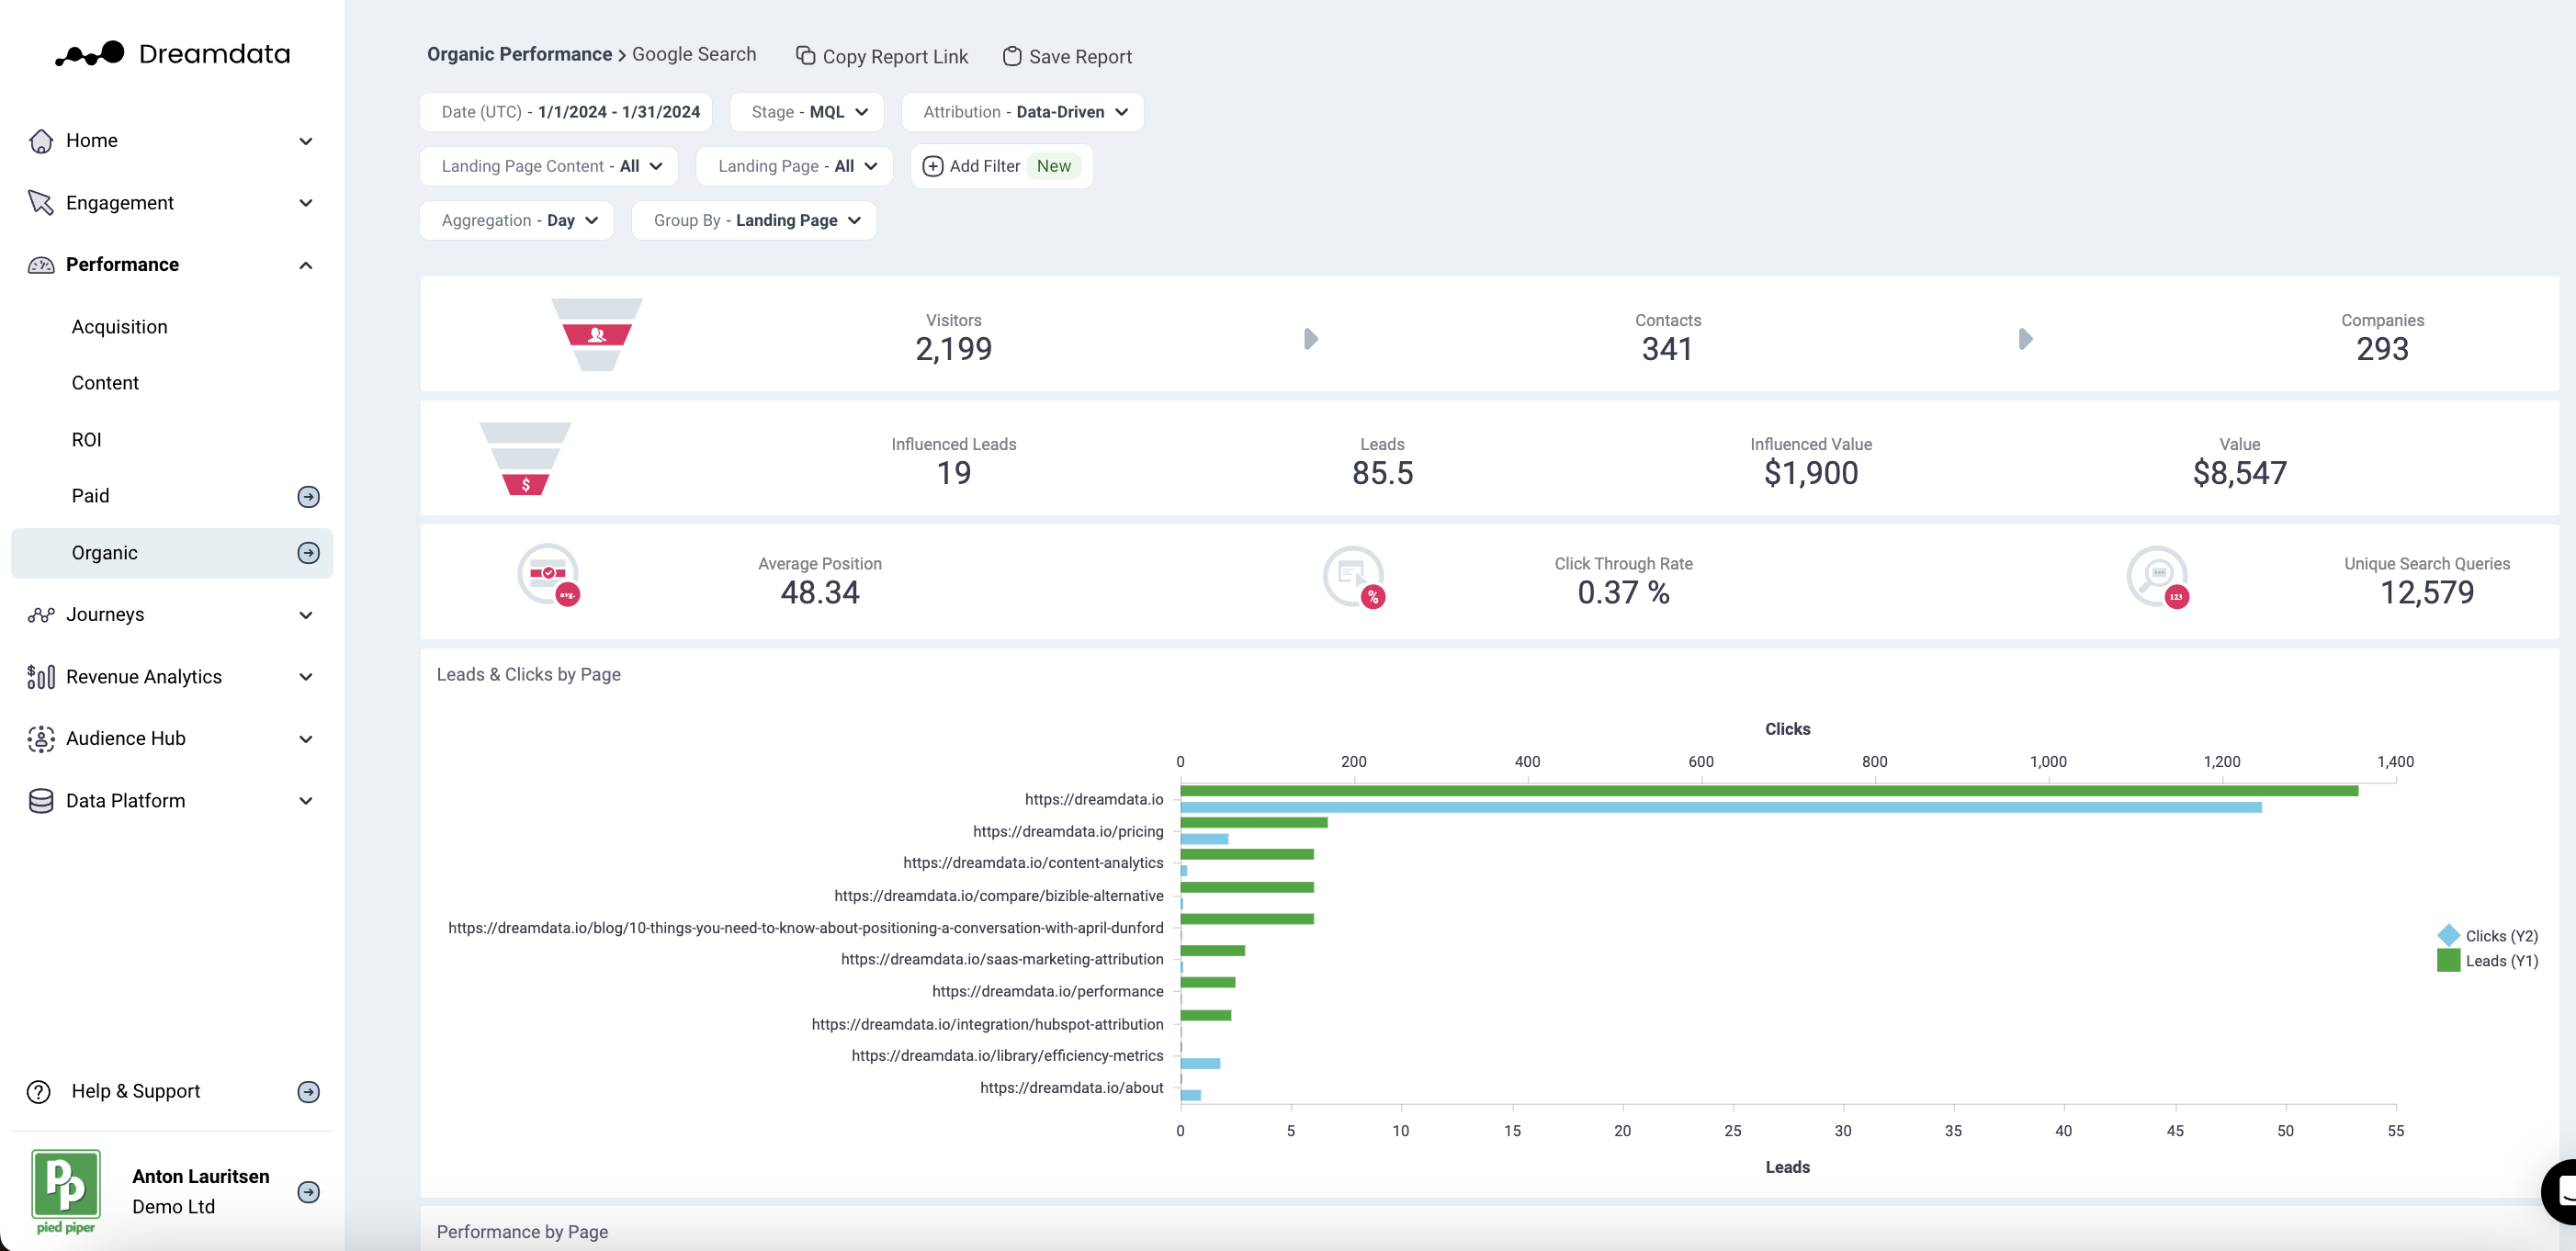
With this dashboard, we provide insights into this individual Search Engine and your website performance which is broken down from Visitors to Average Position and Unique Search Queries.
This report will show how your website visitors moved through the different stages of your pipeline that have come via organic Google Search. Moreover, Search Queries analysis will help you understand certain parts of your customer behaviour (online search intentions).
Filters
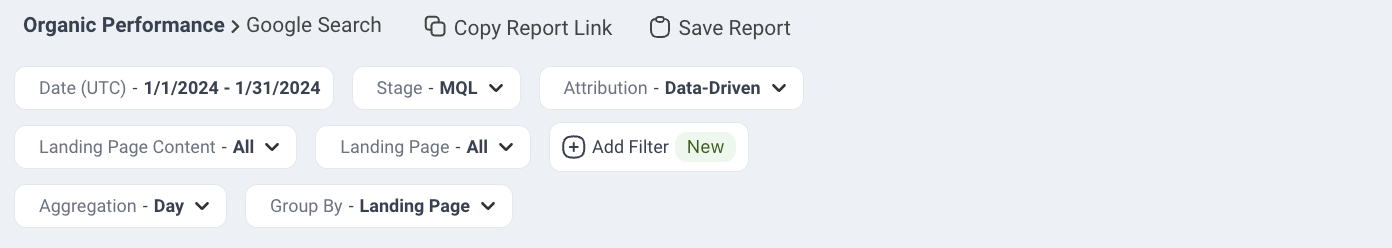
Date: Set the time period you want to investigate
Stage: You can select your preferred pipeline stage. Read more about the Free Tier Stages here
Attribution: Choose the attribution model which is meaningful for your analysis
- First Touch
- Last Touch
- Linear
- U-Shaped
- W-Shaped
Content Groups: Choose the content group you want to analyse
Devices: Choose the device to analyse specific traffic
- Desktop
- Mobile
- Tablet
Group By: Choose certain options to see how it affects your deals
- Page
- Content
- Country
- Device
Metrics
Visitors: The number of visitors who have come to your website via Google Search
Contacts: The number of visitors who we have been able to attach an email to their user id
Companies: The number of companies who are attached to Contacts, or the number of companies in your CRM who can be attached to any visitor traffic (anonymous)
Deals: The number of deals that can be attributed to Google Search according to your Attribution filter and Stage filter
Value: Amount of revenue that can be attributed to Google Search according to your Attribution filter and Stage filter
Average Position: The position on a search engine results page. The sum of the average position index divided by the total of Impressions
Click Through Rate: Total Clicks divided by Impressions
United Search Queries: The number of words or phrases that users type into a search box
Funnel Overview
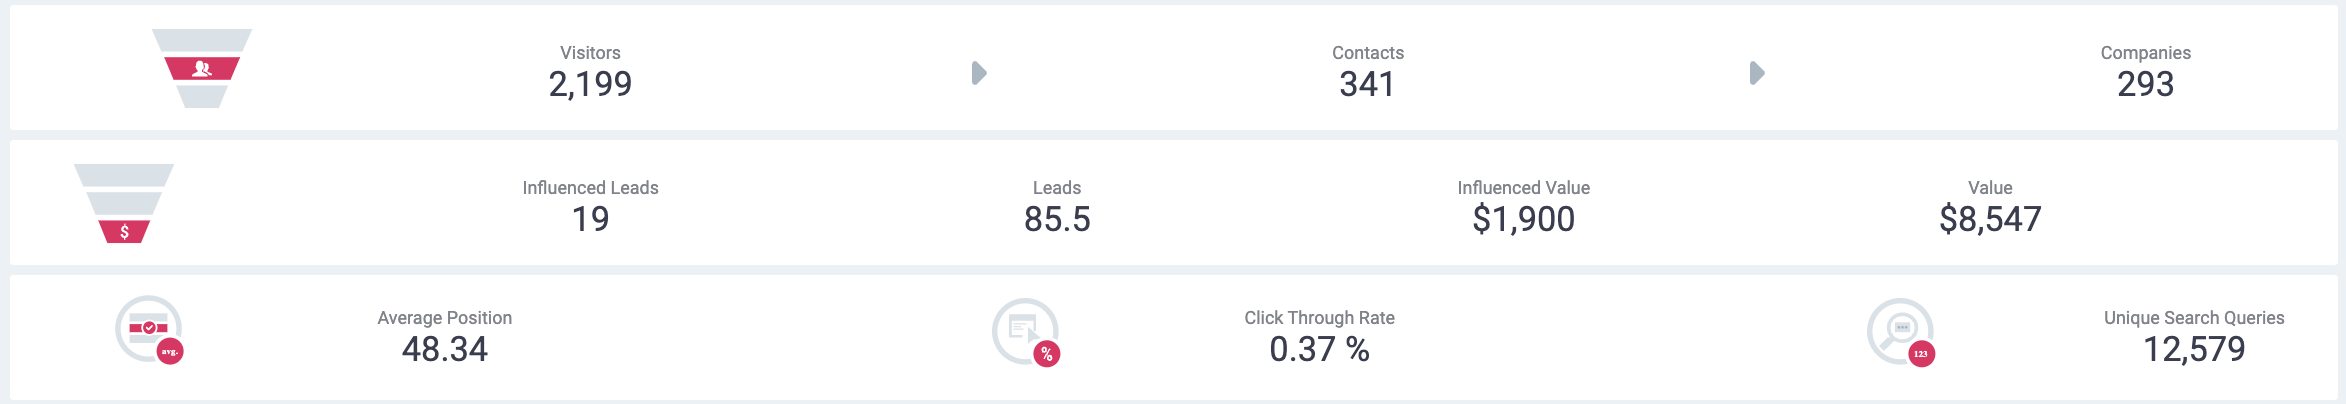
Visitors → Contacts → Companies
In this first section, we give an overview of the traffic from Google Search which is based on the Tracking script we have on your websites.
Influenced Leads → Leads → Influenced Value → Value
In the second section, we provide the total number of Attributable Deals and Attributable Value (revenue) that can be assigned to Google Search based on the filters selected.
To calculate these numbers, we first look at the pool of contacts/companies that visited your website through Google Search based on the dates/filters. Once we have that group, we see what deals were closed after their visit, up to today's date. More importantly, we are only looking at deals where we have a recorded history of sessions; Attributable Deals. This pool of attributable deals will make up the basis for this section. For each of these deals and all their sessions, we will run the Attribution Model you have selected so each session is given a deal and revenue amount.
For both Attributable Deal and Value (revenue), we then provide the sum of these amounts for each session that contains Google Search, depending on which Attribution Model you have selected.
Average Position → Click Through Rate → Unique Search Queries
On the third row, we provide percentages for some common KPIs.
Graphs and Tables
Deals and Clicks by Page
This Graph provides you information about your Leads (sign ups, opportunity created, opportunity won) that have come via Google Search. Important to mention that this graph includes specific pages that accounts have entered before becoming a deal.
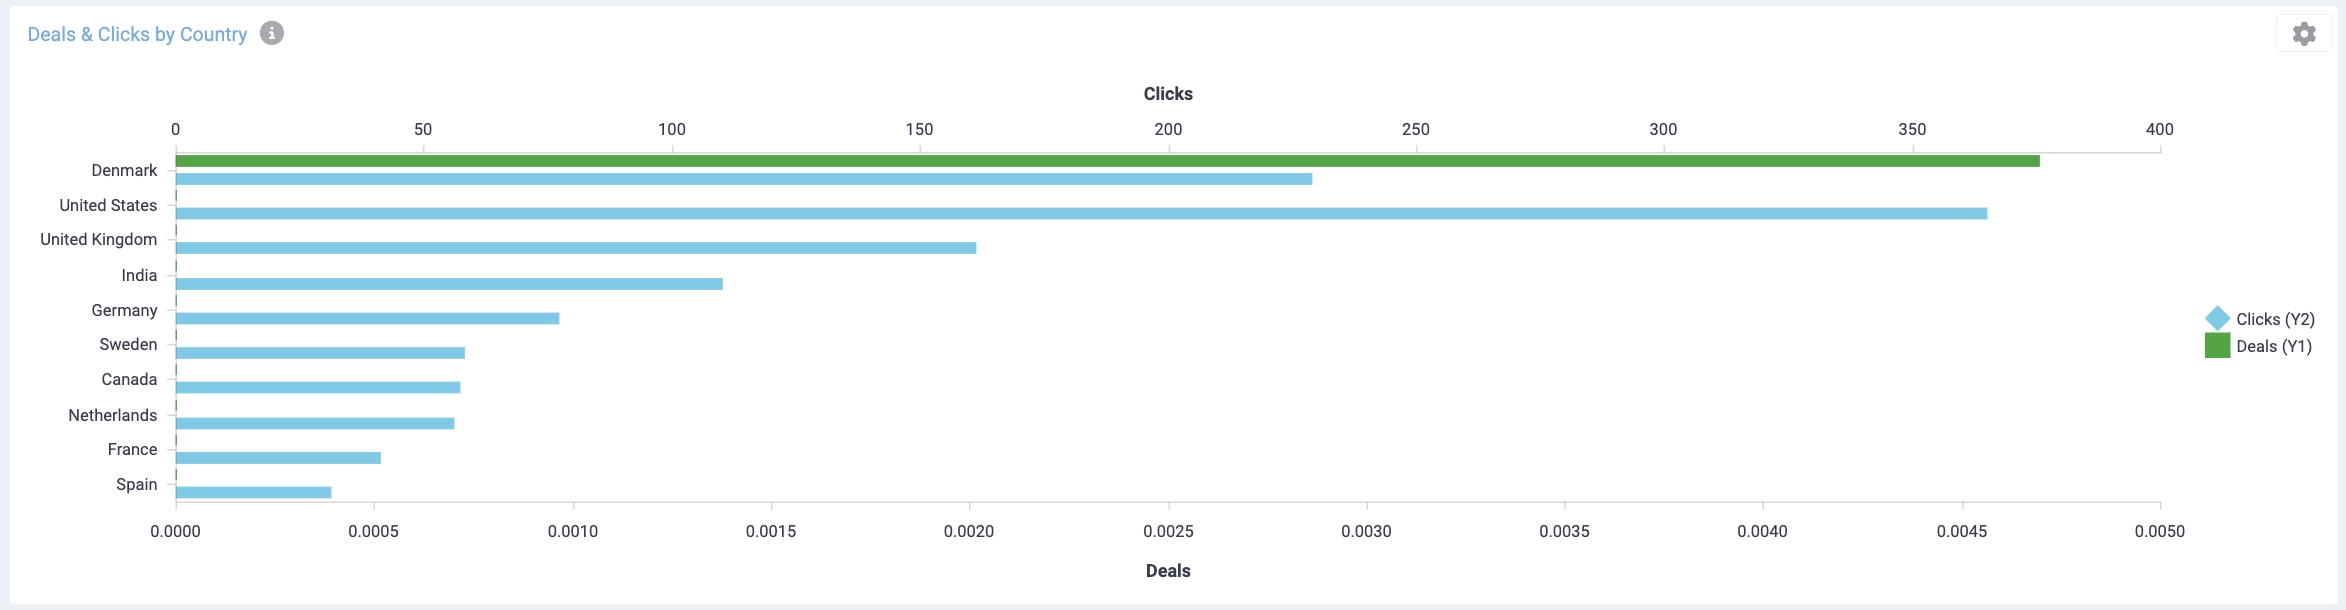
Performance by Country
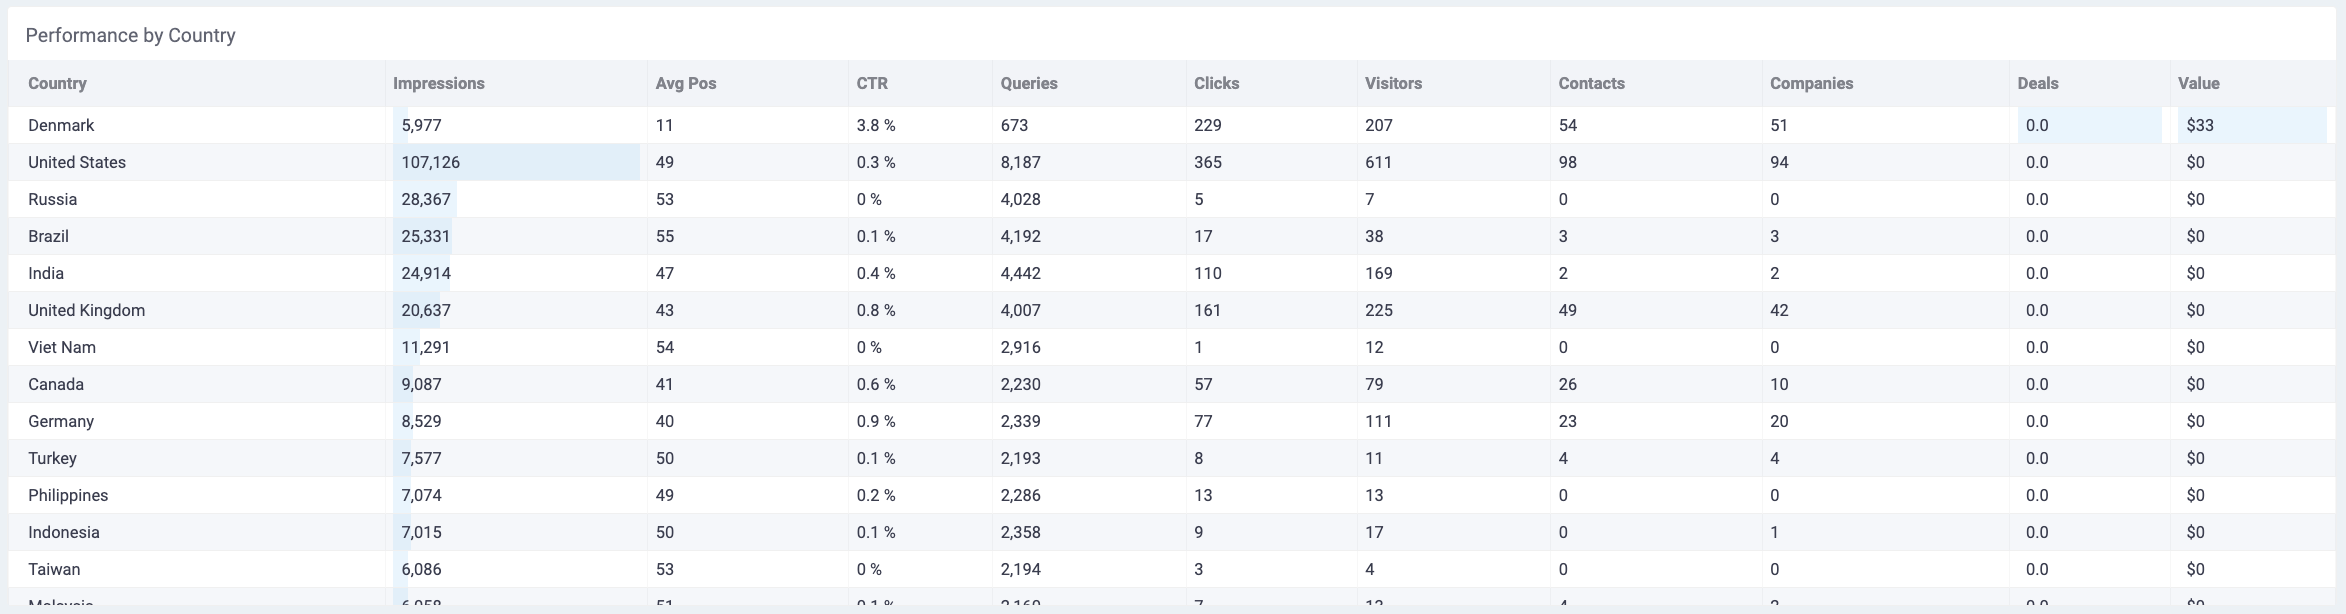
In this table, we list all data about your website's performance based on countries. This helps you understand the weight of different countries (impressions, queries) and the performance of your website in regards to these countries (average position, ctr, deals).
Performance by Page
This report shows which website pages have been used by Google Search Visitors, and which pages bring more value than others.
Performance by Content
This report shows which contents (videos, blog, website, etc.) have been used by Google Search Visitors, and which contents bring more value than others.
Performance by Device
This report shows which devices have been used by Google Search Visitors, and which Devices bring more value than others.
Deals Split by Country over Time
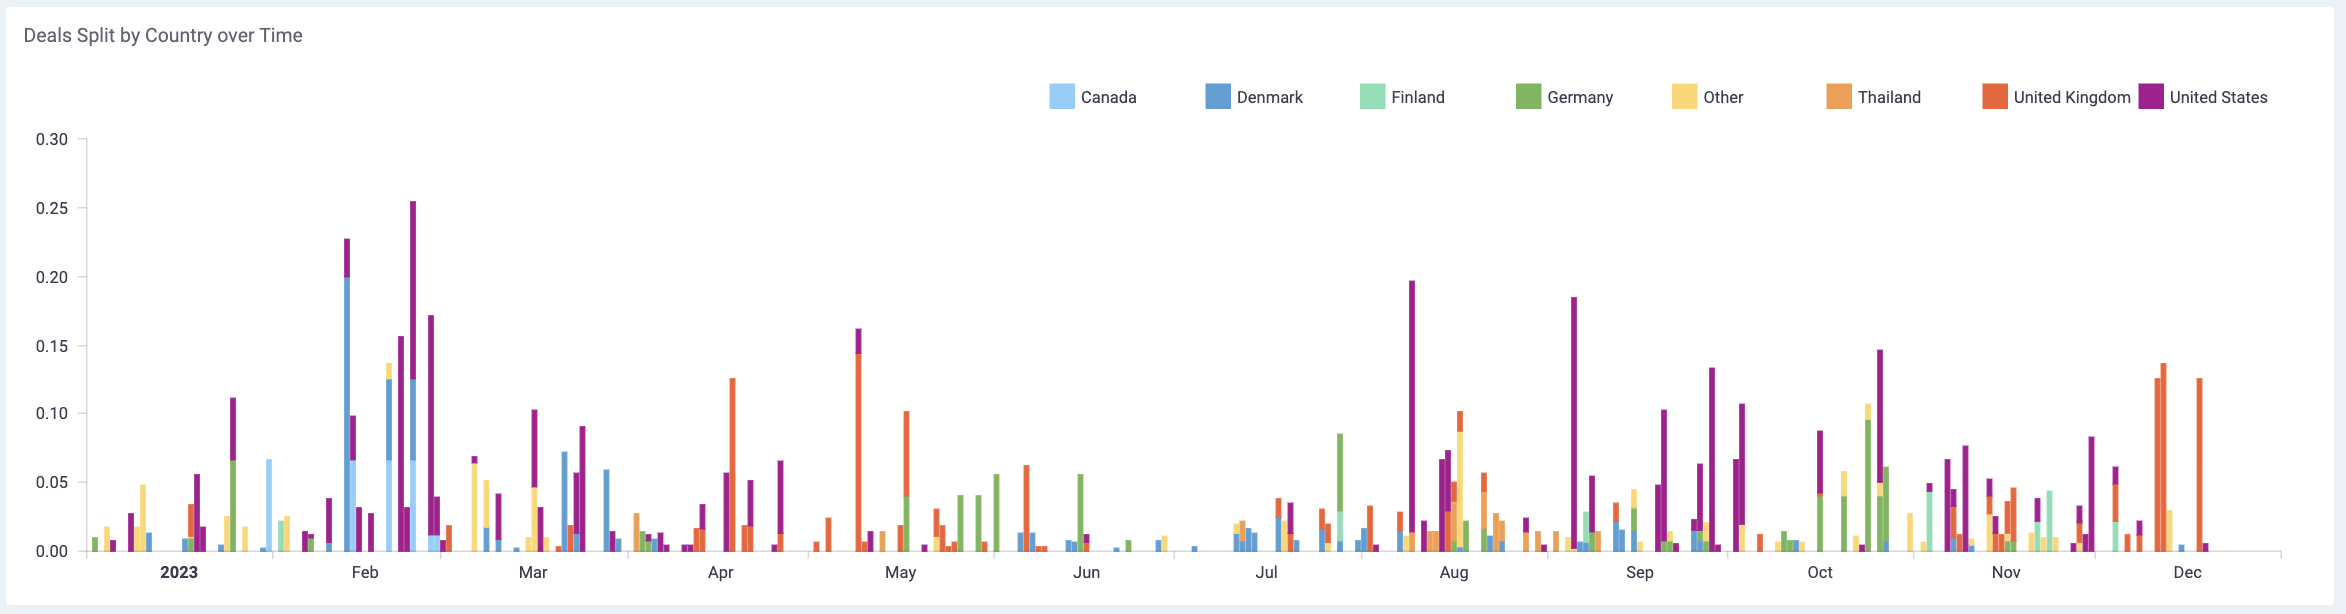
In this graph we will visually show which Country that uses Google Search generates the most Deals (sign ups, opportunity created, opportunity won) to your business over chosen time frame. Use the Aggregate filter to breakdown the X-Axis as you wish e.g. (day, week, month).
Search Query Performance based on Impressions
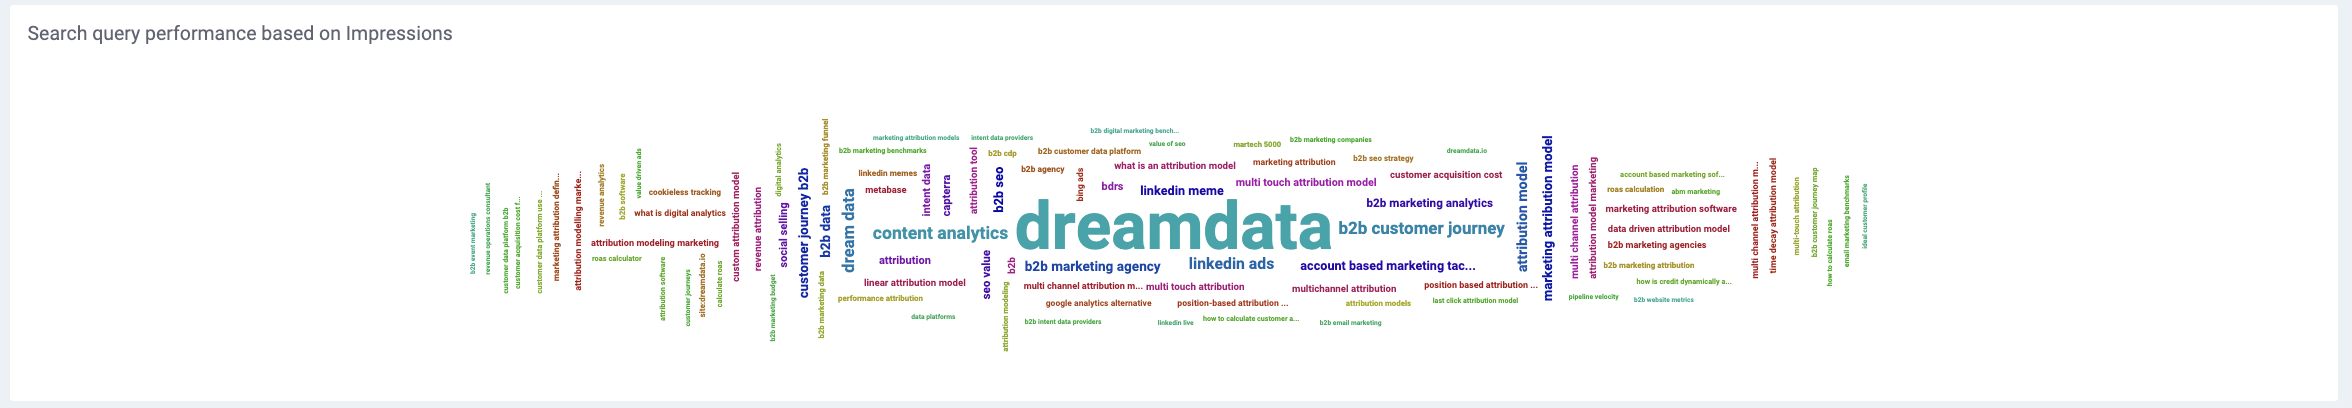
This text data will visualise your search query analysis by using a word cloud. Hover over the text to see each query's impressions, clicks, ctr and average position.
Search Query Performance
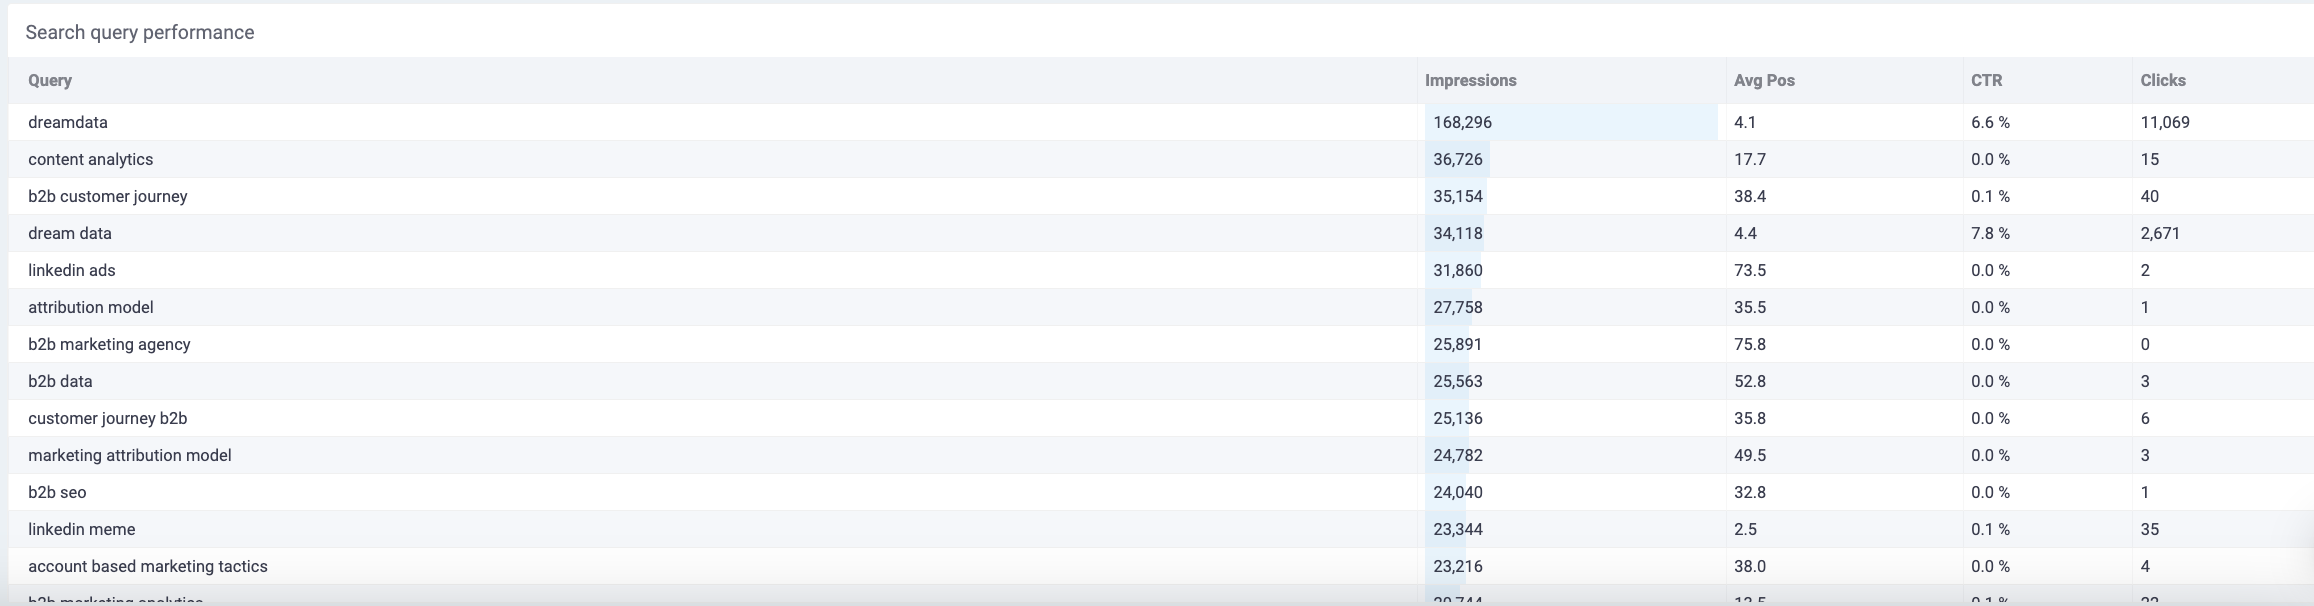
People perform searches with different intentions. These intentions can be categorised into three different types: informational, navigational and transactional. You will get an overview of peoples' intentions by knowing their search queries.
This table provides words or a group of words used by people in Google Search engine. Consequently, these Search Queries have matched your website's content to a certain extent. Therefore, you can investigate your website performance over a specific Search Query and user intention. This data will also help you to evaluate different queries weigh (impressions) over your performance (average position and ctr of each query).