Content Performance - Dashboard Options
 Updated
by
Mikkel Settnes
Updated
by
Mikkel Settnes
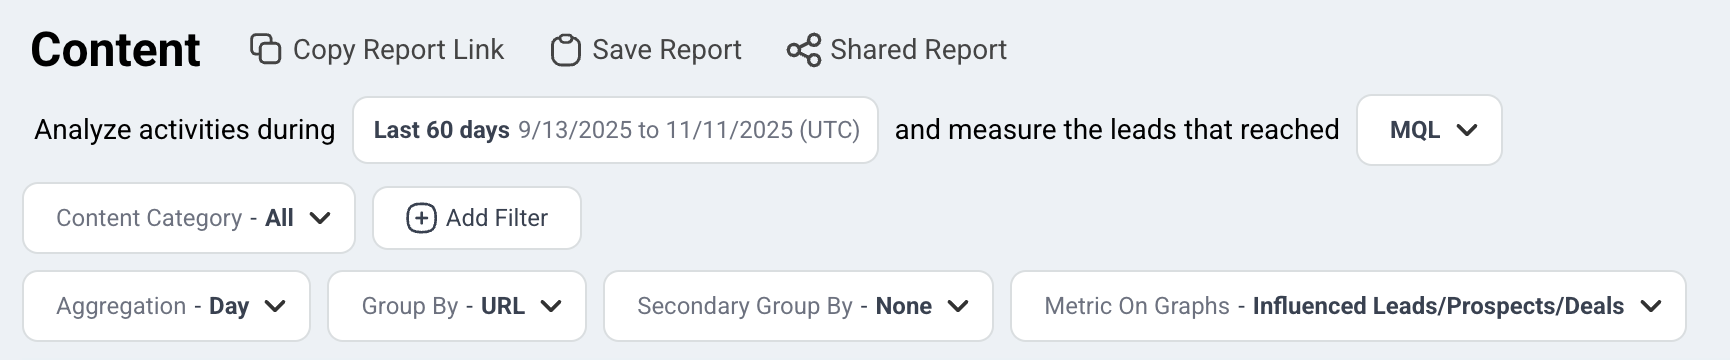
Stage
Determines which pipeline stage is considered in the report below. Use this to change reporting based on your desired business objective.
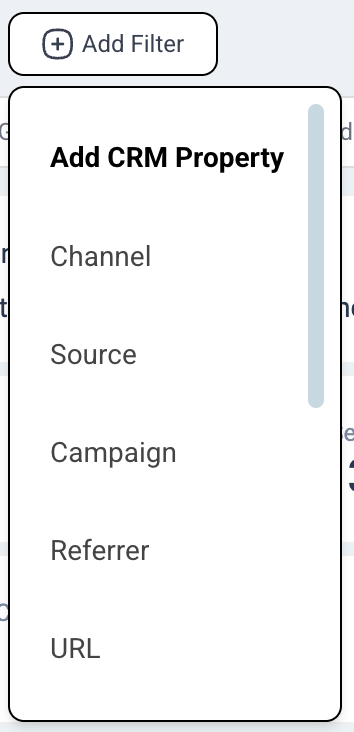
Filters that can be applied to consider a specific subsection of the available content:
- Content Category: the category of the content (this is setup when setting up the content within the Dreamdata application - find out how)
- Channel: the channel of the session containing the content view
- Source: the source of the session containing the content view
- Campaign: the campaign of the session containing the content view
- Referrer: the referrer of the session containing the content view
- URL: find specific url’s
- Event: find specific events
- Host: the host name of the URLs
- Conversion Name: you can select all the events (default), only sessions with conversion events or the ones without them
- Branded Search: filter by branded or non-branded campaigns
Aggregation
The time aggregation of the graphs that presents over time views
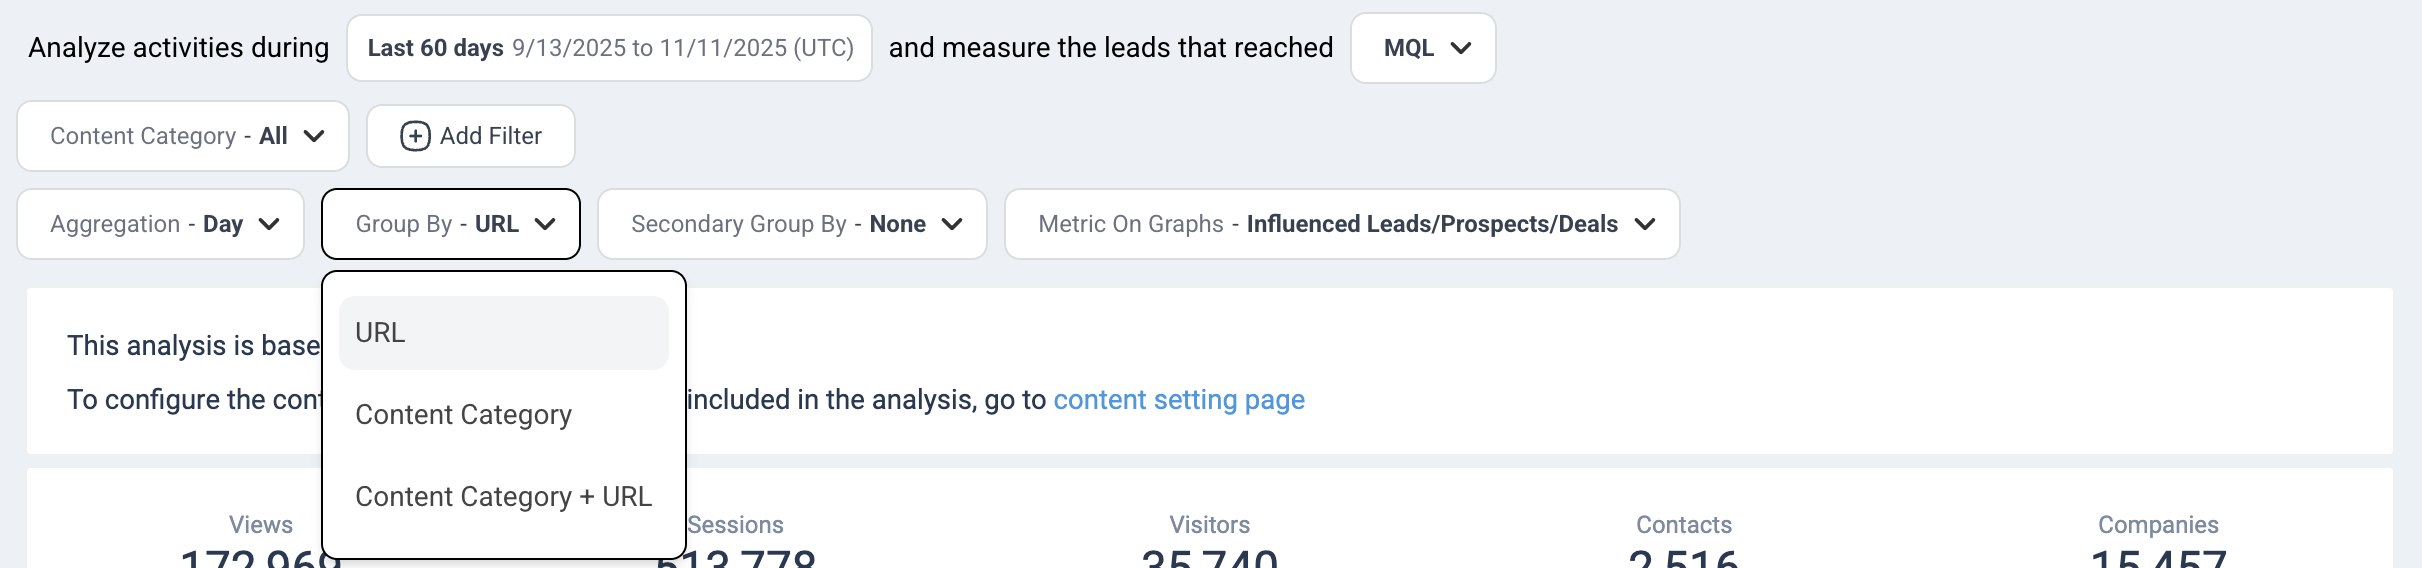
Group By
Determines the granularity of the content. Ex. URL will show the URL of the content, whereas Content Category aggregates multiple URL’s into the specific categories that are setup.
- URL
- Content Category
- Content Category + URL
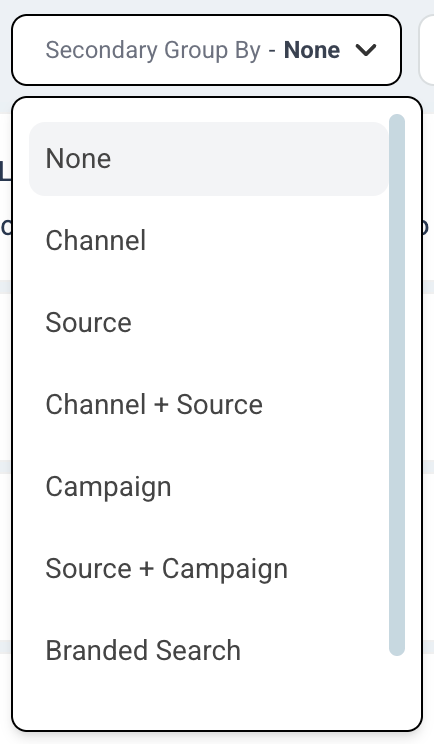
Secondary Group By
The secondary group by option provides the ability to further split the content depending on
- None: no extra splitting will be performed
- Channel: the channel of the session containing the content view
- Source: the source of the session containing the content view
- Channel + Source: the channel and source of the session containing the content view
- Campaign: the campaign of the session containing the content view
- Source + Campaign: the source and campaign of the session containing the content view
- Branded Search: group by branded or non-branded campaigns
- Channel + Branded Search: group by branded or non-branded campaigns and channels
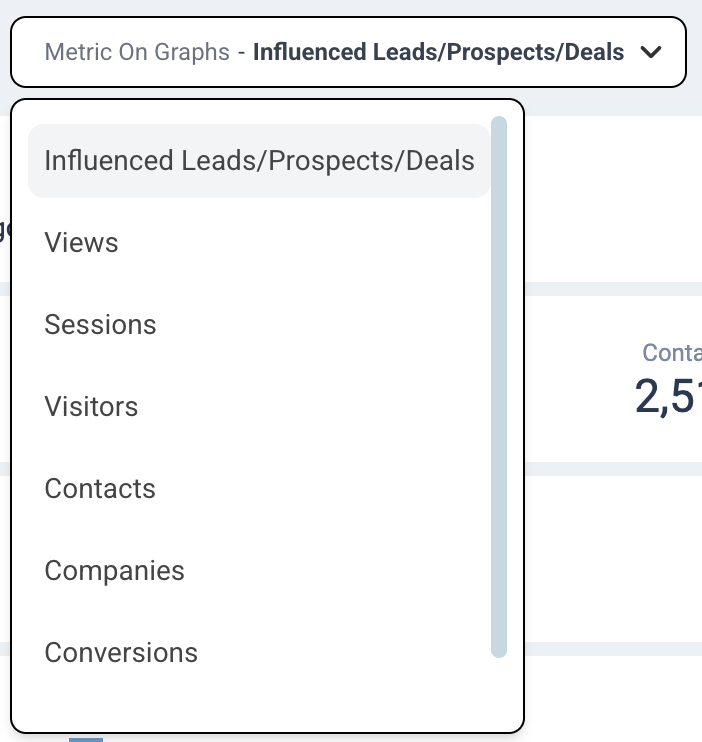
Metric On Graphs
This controls the metric that will be shown on the graphs in the report below. We can choose to show the metrics:
- Influenced Leads/Prospects/Deals: Leads/Prospects/Deals that was influenced by the content
- Views/Counts: the number of individual page views or the number of events
- Sessions: the number of sessions that the content was observed in
- Visitors: the number of unique visitors
- Contacts: the number of unique emails that was influenced by the content
- Companies: the number of companies that was influenced by the content
- Conversions: the number of conversions. The definition of conversions are the one setup within the Dreamdata application. Repeated conversions on same url in same session are not counted.
- Influenced Value: the total revenue that came from these Influenced Leads/Prospects/Deals