Real-Time View
Real-Time allows you to monitor activity on your site or app as it happens. Real-Time metrics are updated continuously and each hit is reported with a 3-minute delay.
.
What data is displayed
The dashboard includes metrics related to visitors, page views and events.
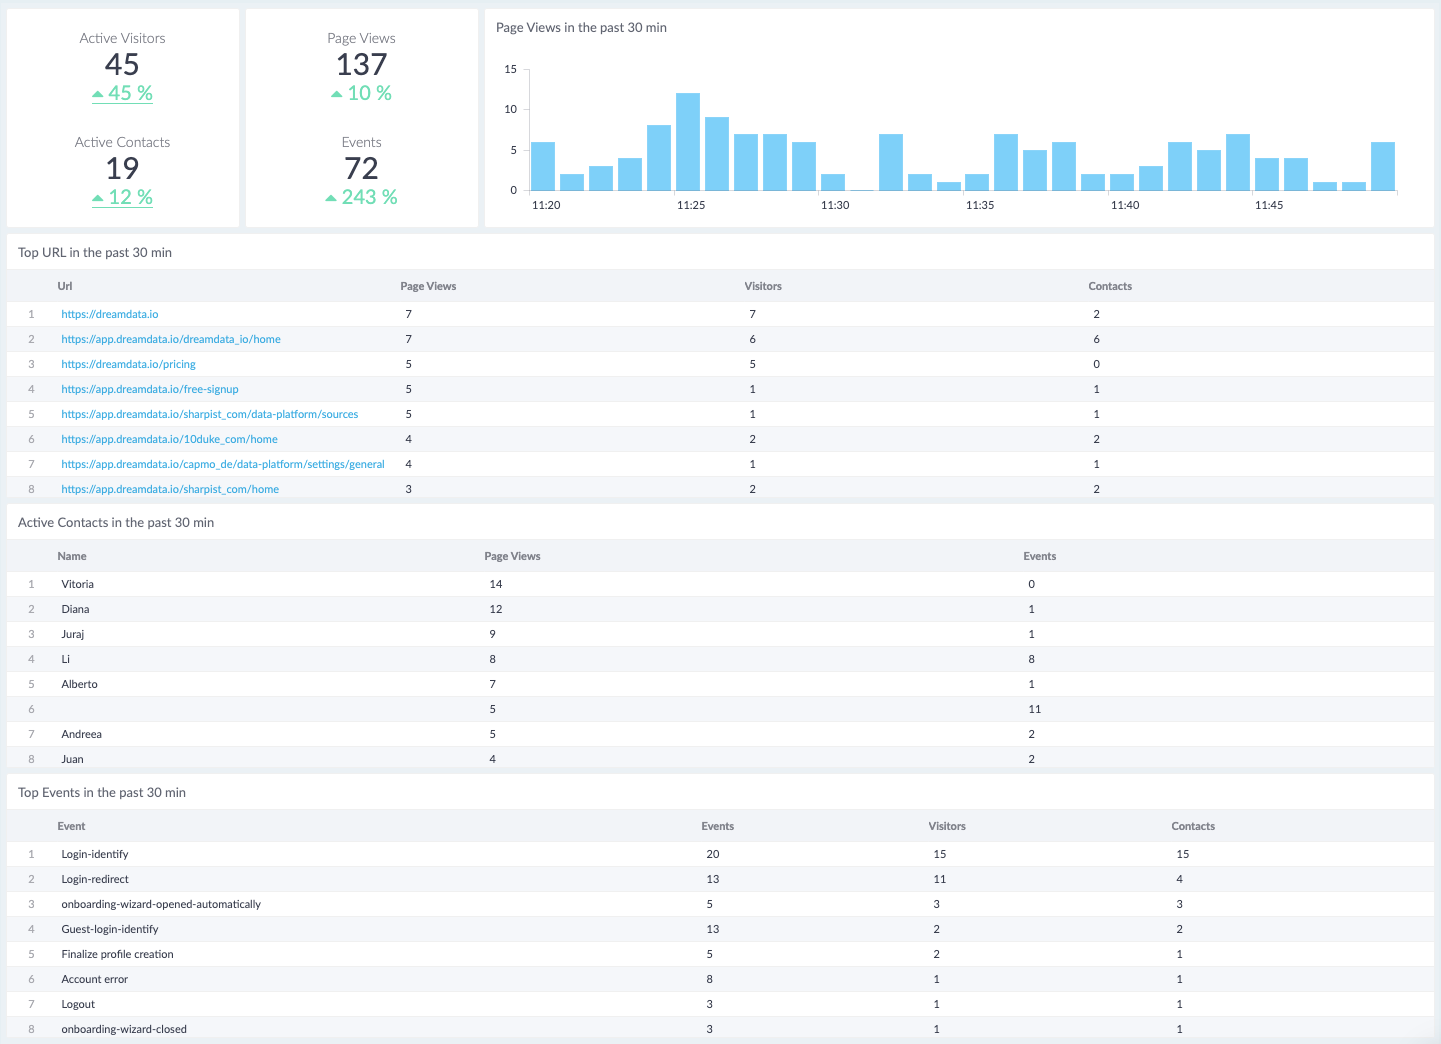
The Active Visitors box
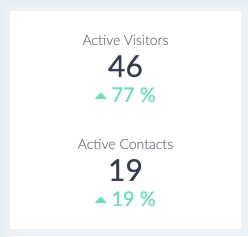
The metric Active Visitors includes all visitors who have been active on your site during the past 30 minutes. The subgroup of active visitors for whom the email address is known is shown as Active Contacts. The percent change is calculated by comparing the group of active visitors/contacts during the past 30 minutes with the same group from 30 to 60 minutes ago.
Page Views & Events box
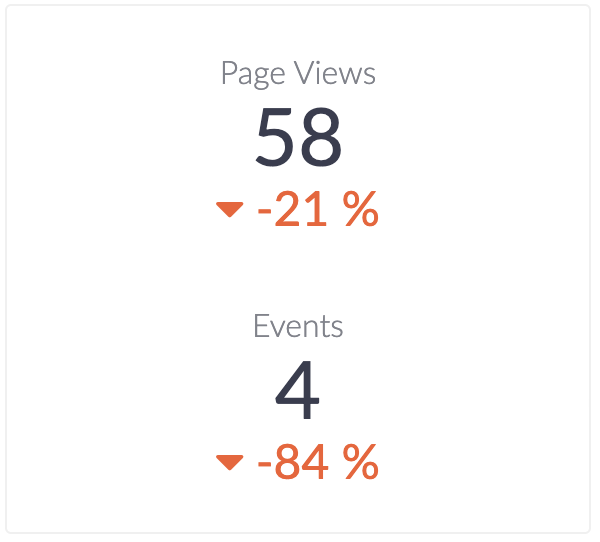
The metrics Page Views and Events include all page views and events on your site during the past 30 minutes. The percent change is calculated by comparing the group of page views and events during the past 30 minutes with the same group from 30 to 60 minutes ago.
Page Views bar chart
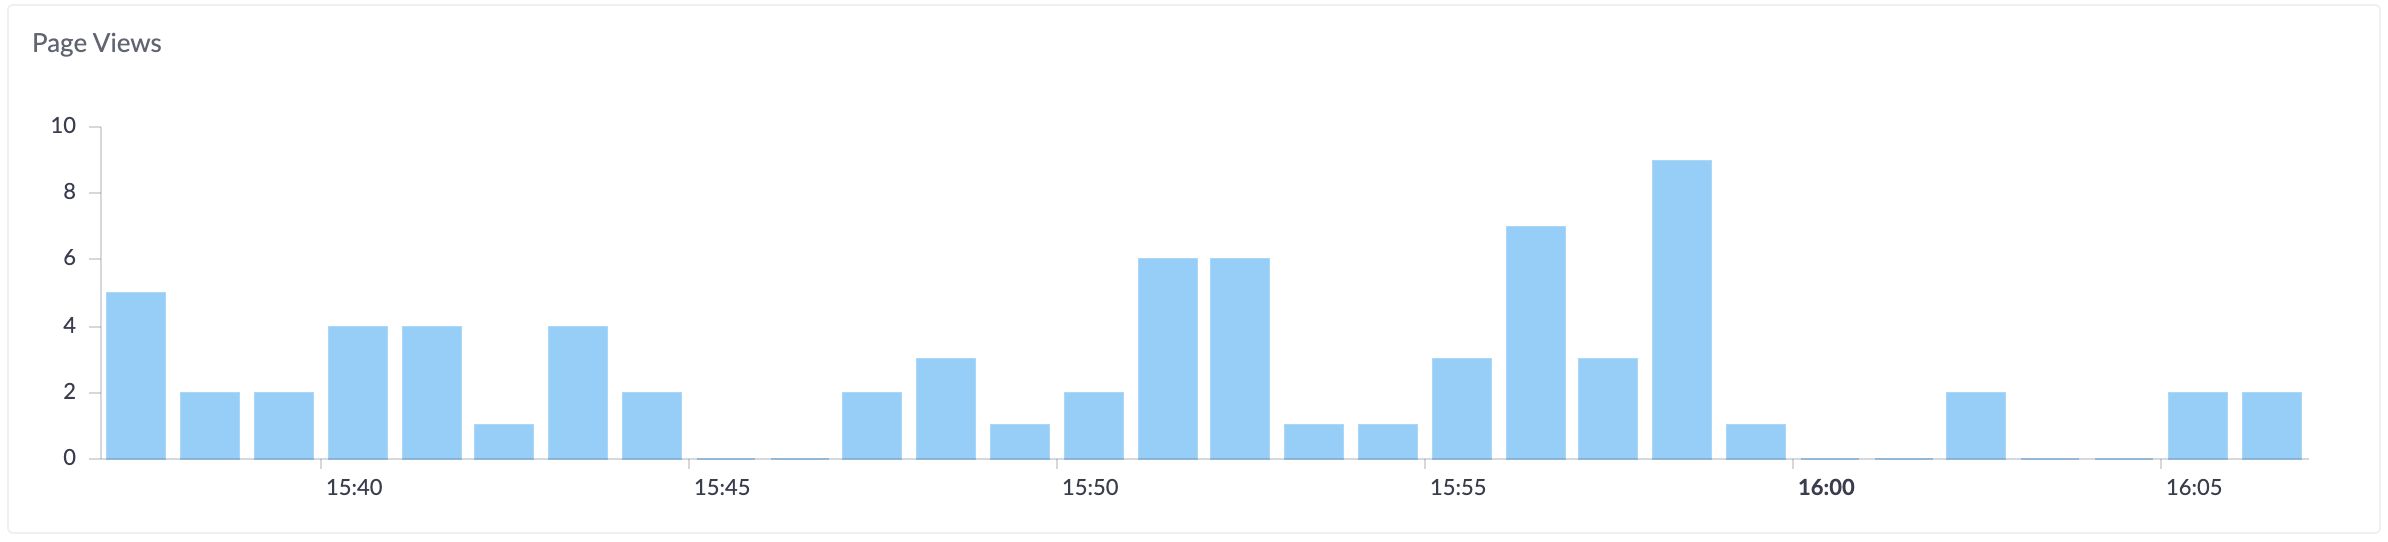
The page-view bar chart shows the number of page views per minute over the past 30 minutes.
Top page-views performers with Group By
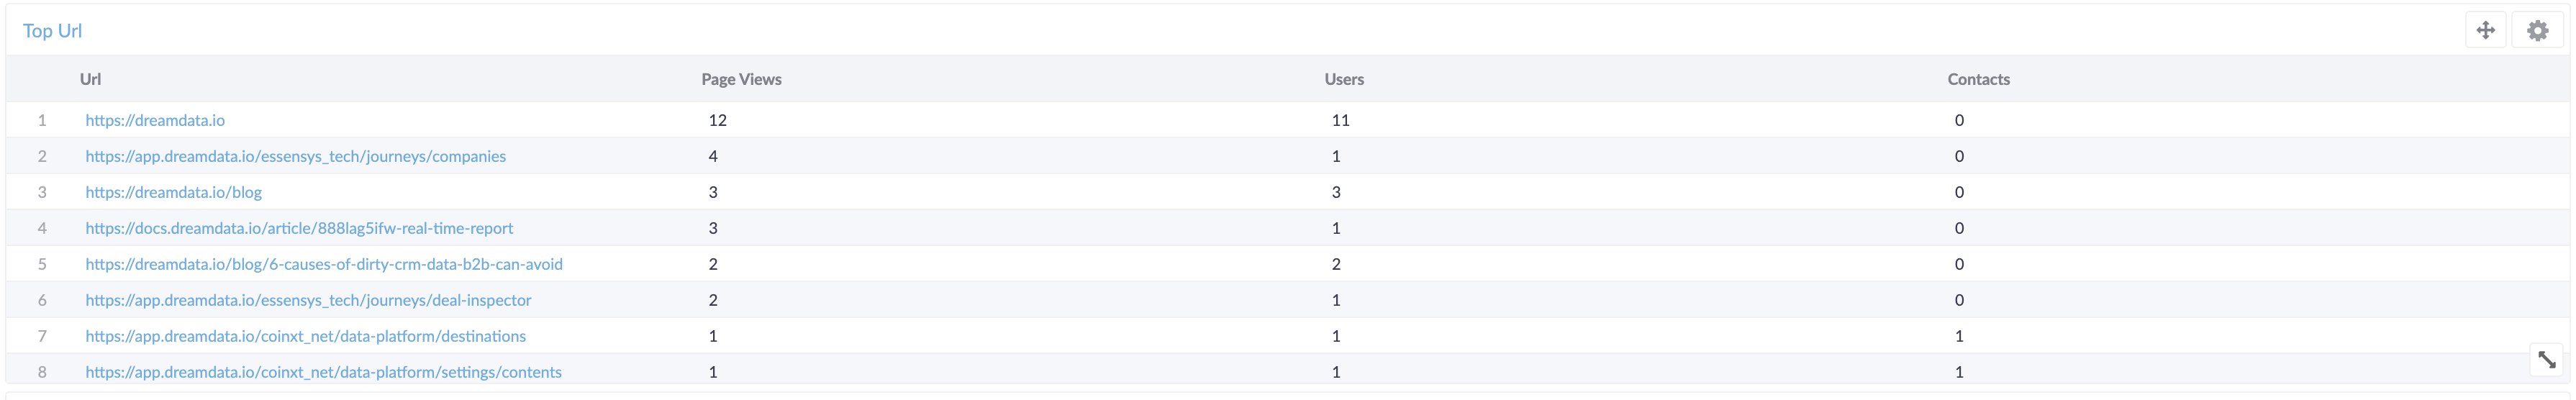
Real-Time allows you to group page-view traffic in the following ways:
- by Url. This is the address of the page on which the activity was triggered.
- by Referrer. This is the address of the previous web page from which a link to the currently requested page was followed.
- by UTM Source. Identifies which site sent the traffic, and is a required parameter (Ex.: utm_source=google).
- by UTM Medium. Identifies what type of link was used (Ex.: utm_medium=cpc).
- by UTM Campaign. Identifies a specific promotion or campaign (Ex.: utm_campaign=marketing_analytics).
- by UTM Term. Identifies search terms (Ex.: revenue+attribution).
Active Contacts table
The active contacts table shows the activities of active contacts during the last 30 minutes. Activities include the number of page views and events completed by each contact.
Top Events table

The Top Events table ranks the events on your site by usage. You can see the number of users of each event and how many of these are contacts.
.
Ways to use Real-time:
As mentioned, you can use Real-Time to see how many people are on your site right now, which pages or events they're interacting with, and which goal conversions have occurred. Additionally, you can:
- monitor the immediate effects on traffic from a blog, social network post, tweets, or podcast
- monitory/identify active users and contacts on your site
- verify that the tracking code is working on your site or app
- monitor whether new or changed content on your site is being viewed
- see whether a one-day promotion is driving traffic to your site or app, and which pages these users are viewing
- understand usage of your app through event tracking
.