Events report
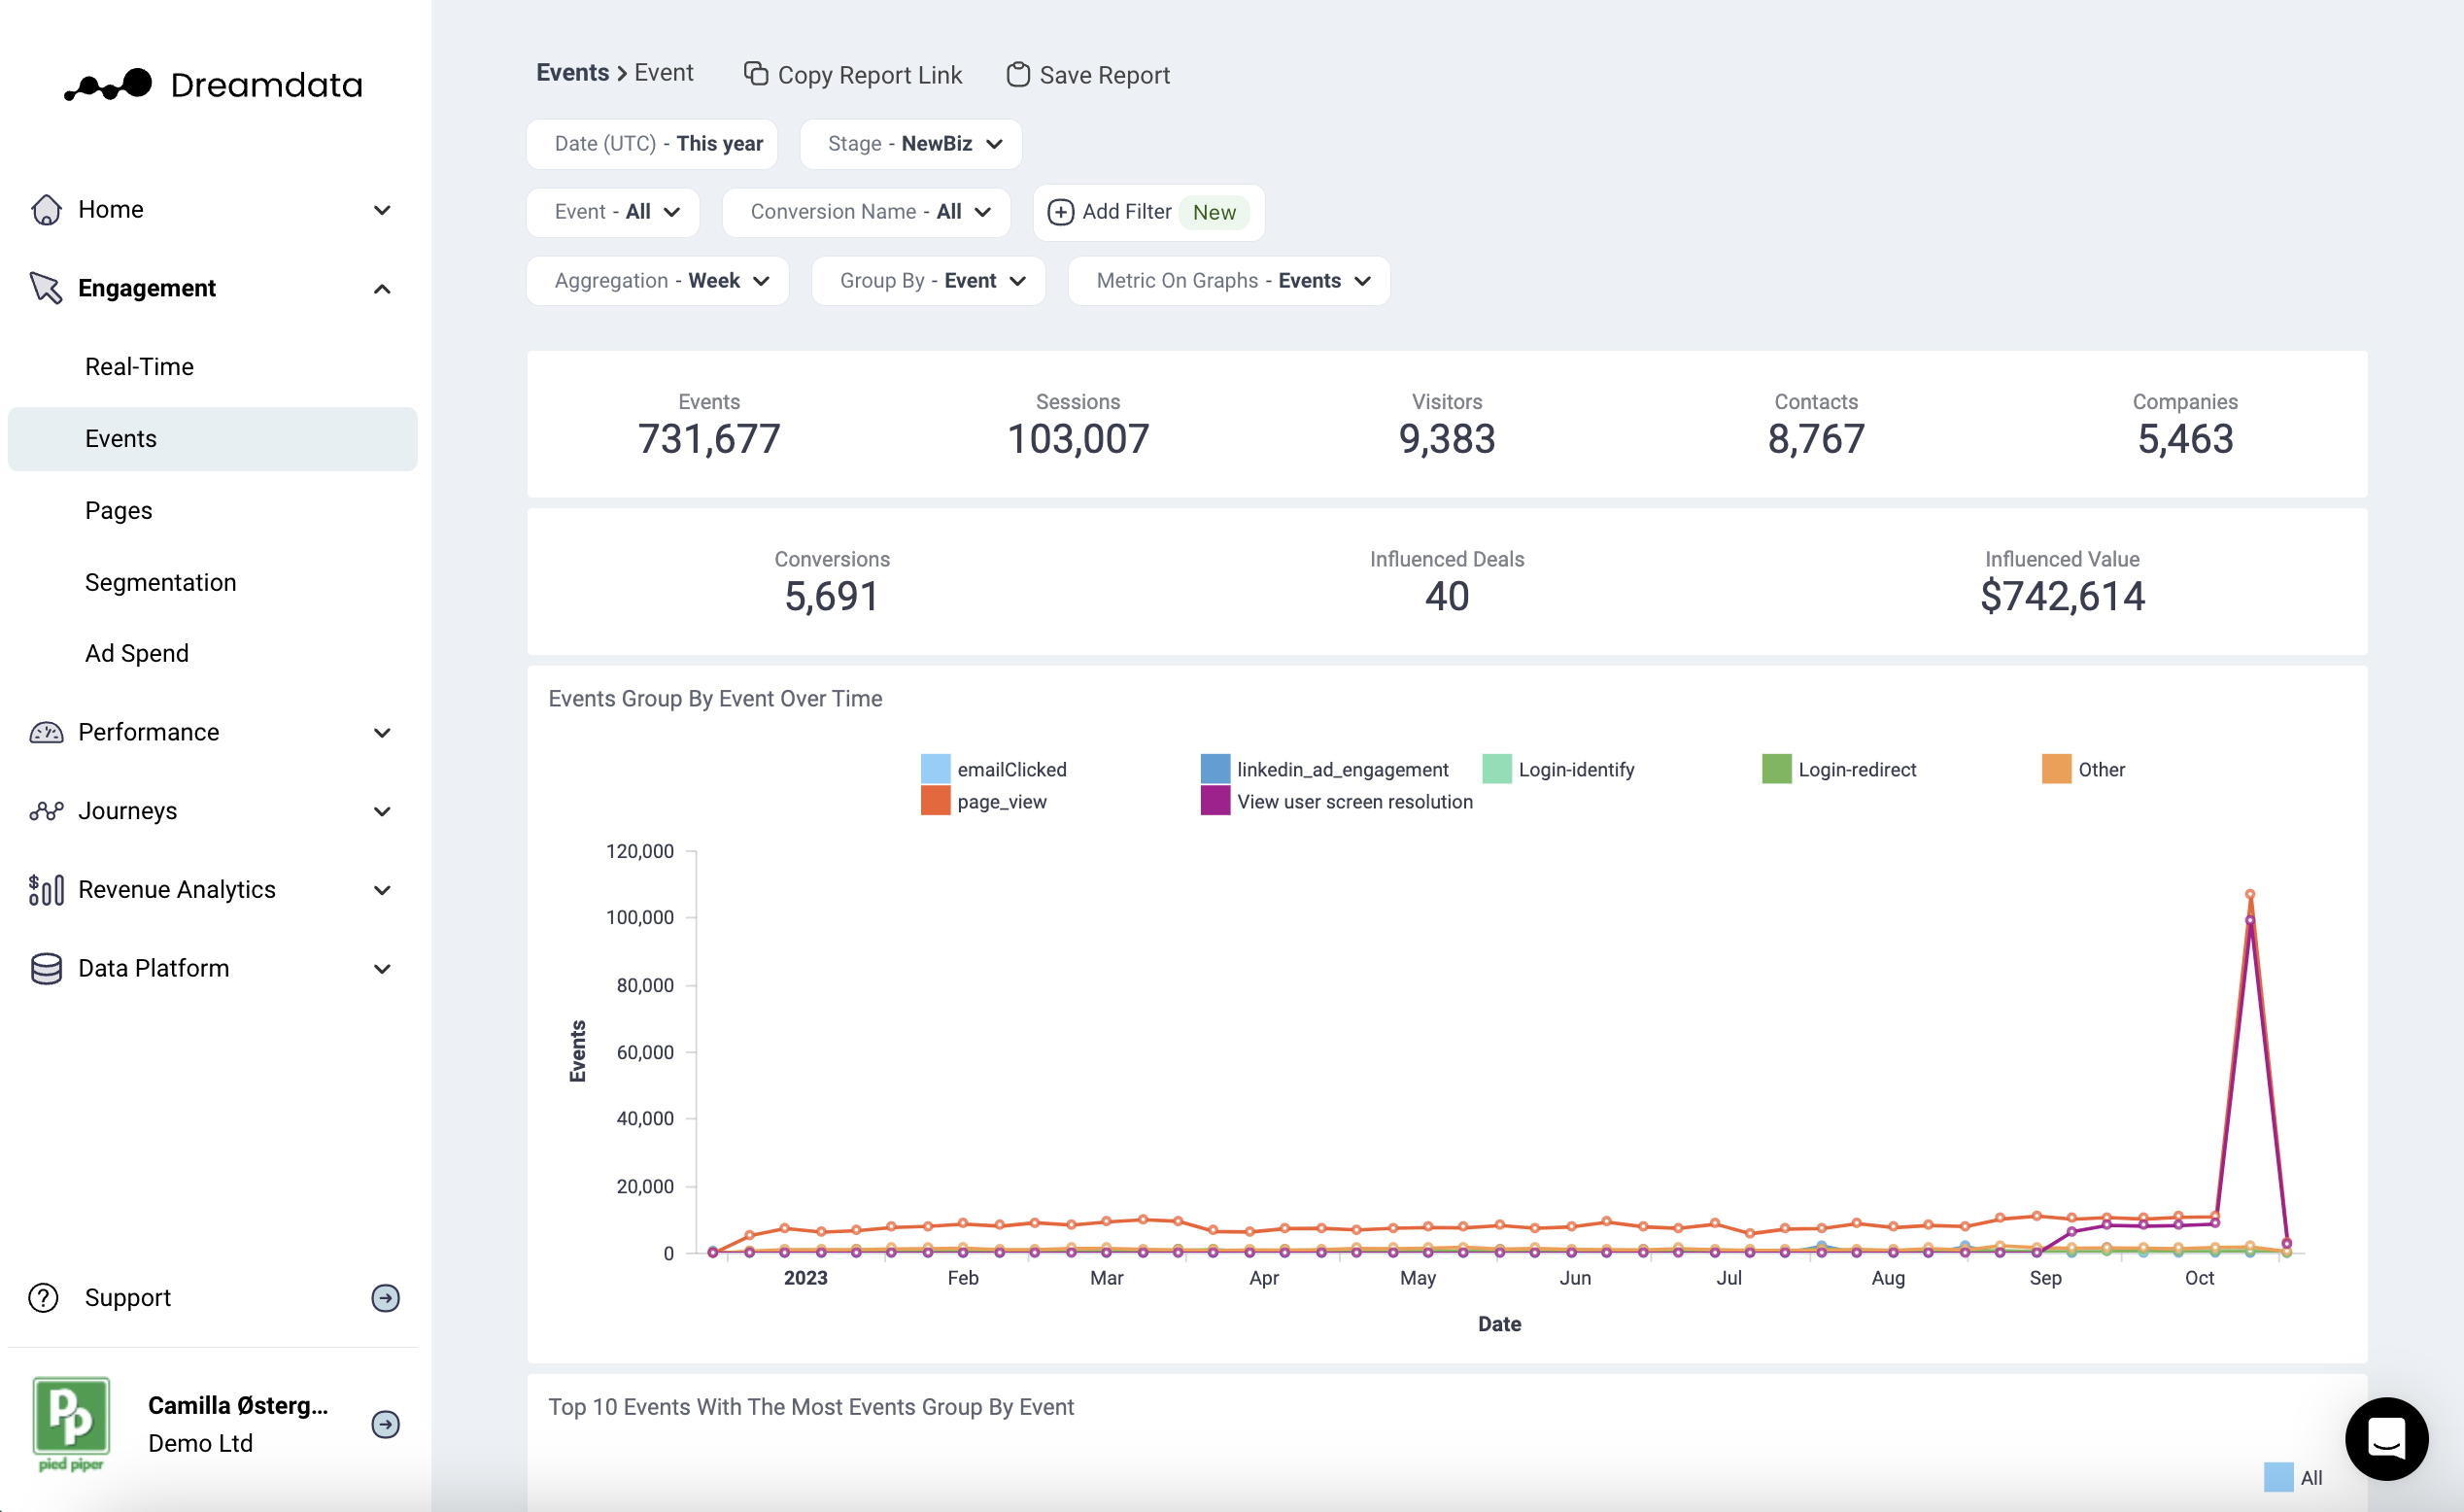
The Events Report provides a comprehensive analysis of all tracked touchpoints, referred to as 'events', within a specified time frame.
This report captures the trends over time, and it also consolidates data on the total number of visitors, identified contacts, and accounts associated with each unique interaction event.
As a result, you can gain a deeper understanding of the behaviors and patterns of people engaging with your website.
What interesting metrics can I get from this report?
- Details of each event (when, who and how it happened)
- The influenced value/deals of each type of event
- What triggers certain events?
- What previous URL did people come from?
- How many influenced leads do events generate?
- How many leads per session did each event generate?
- Event conversions
Grouping & Filters
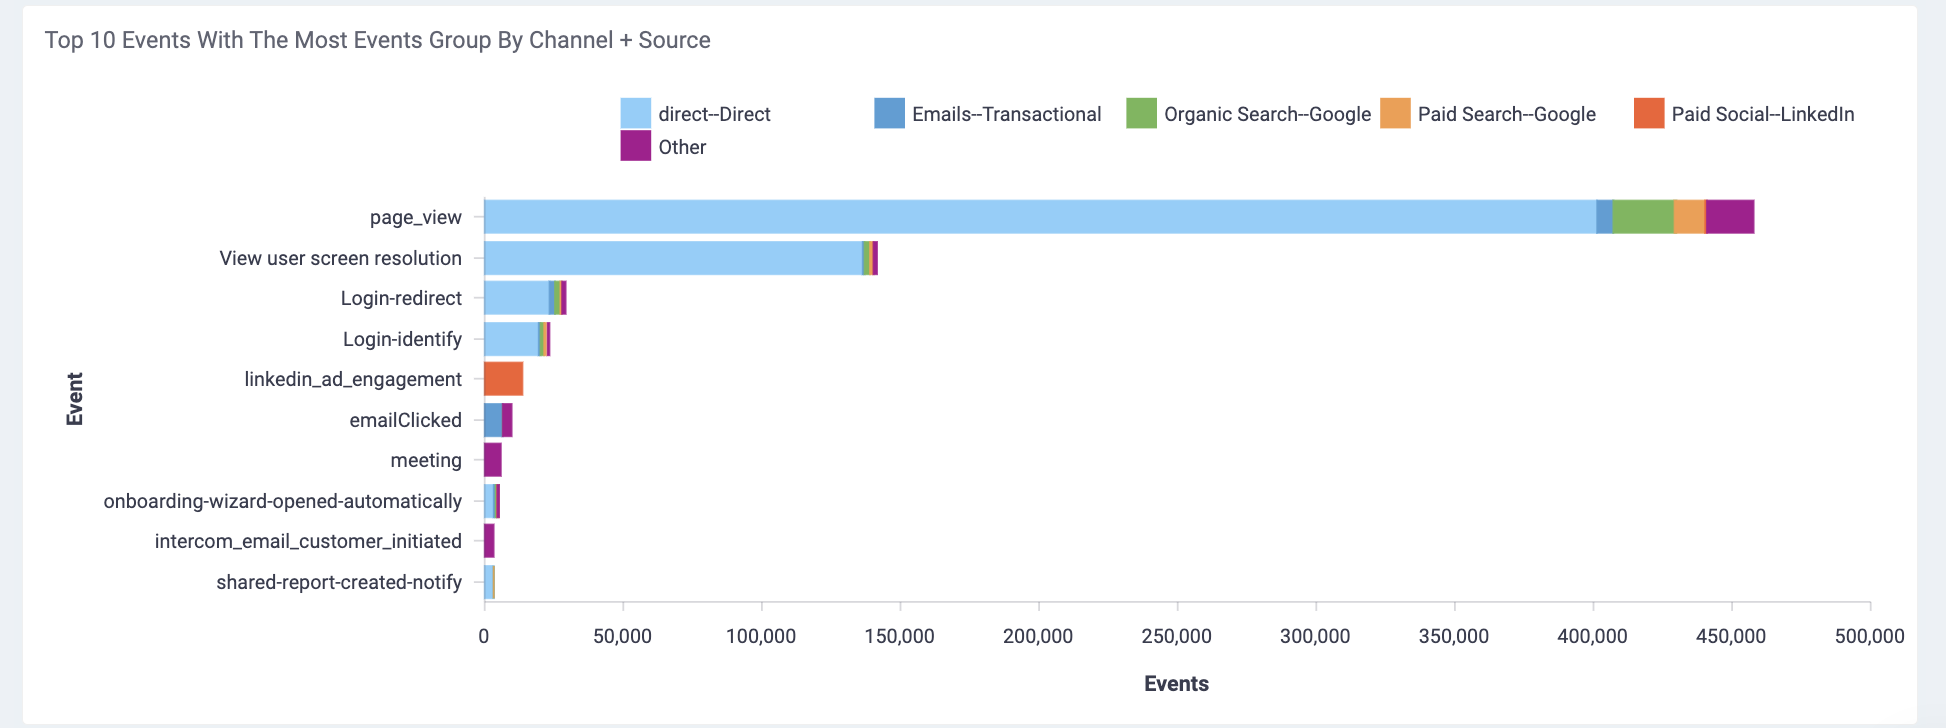
In the screenshot below, we've grouped the data by 'Channel' and 'Source'. This configuration helps you determine the primary sources from which people are triggering the event.
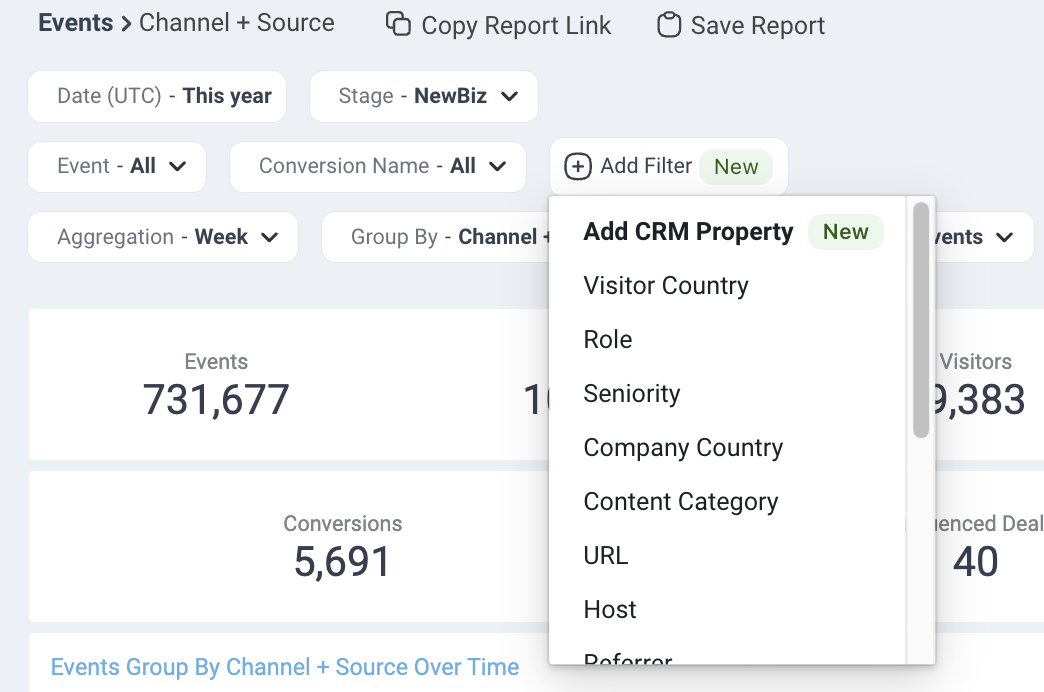
You can also now filter by Role and/or Seniority. As well as filter by one of your own CRM properties as a Business or Enterprise user (learn more here).
You can filter the events report by 'campaign' or by 'event campaign'. 'Event campaign' is the campaign assigned to the specific event. 'Campaign' filter is the session campaign. This means it will filter on the first campaign of the first event in the session. For this reason, it is possible that the campaign and event campaign will not have the same value.
Typical questions you will find answers to through the Events report
How many people downloaded the ebook last month? Is this number increasing or decreasing?
Dreamdata’s Digital Analytics measures performance against conversions*, but also extends this to advanced impact analytics in order to discover the traffic and conversions impact on pipeline and revenue on account level.
*conversions: a single tracked event that is labeled as a conversion. This is similar to conversions defined in tools such as Google Analytics.
Of the people downloading the ebook last month, how many companies do they represent and how many turned into pipeline?
This allows us to identify which activities lead to conversions, pipeline and revenue.
For people who have identified themselves (ex via form submissions), we can further deep dive into who (people or account) performed specific events, allowing for advanced creation of audiences.
Who (person or account) coming from a Paid channel, downloaded the ebook or registered for the webinar last month?
In addition, the report allows for segmentation of each tracked event by changing the ‘Group By’ option. This creates segments for each event based on properties such as Channel, Source, Campaign, Referrer etc. So we can investigate where people come from when performing a certain action.
What is the top Source / Channel bringing in people who fill out the ‘book-a-demo’ form? Are Paid or Organic driving sign-ups?
Dreamdata furthermore allows you to define customized metrics based on ex. CRM properties and actions. You can track the performance of these metrics in a similar way as you would for conversion events.
Funnel like analysis of the conversion from performing a specific event to a desired business outcome (a stage); e.g. of the companies that did the event "demoBooking", how many became a sales opportunity?
The Engagement → Events report allows you to select everybody who saw a performed a specific event in a certain time period and then see how many of those later went on to reach a specific business outcome (a stage). A typical scenario could be figuring out how many of the people that did the "demoBooked" event later became a sales opportunity or even new business.
If you have any questions, please reach out to friends@dreamdata.io