Templates
 Updated
by
Aleksandar Grbic
Updated
by
Aleksandar Grbic
Templates are pre-built report configurations that help you get started quickly. Each template pre-populates the configurator with metrics, filters, and settings that address a common use case so you can generate a meaningful report in just a few clicks.
Accessing the Template Gallery
- Navigate to the Analytics Hub home screen.
- Click Create New > Report.
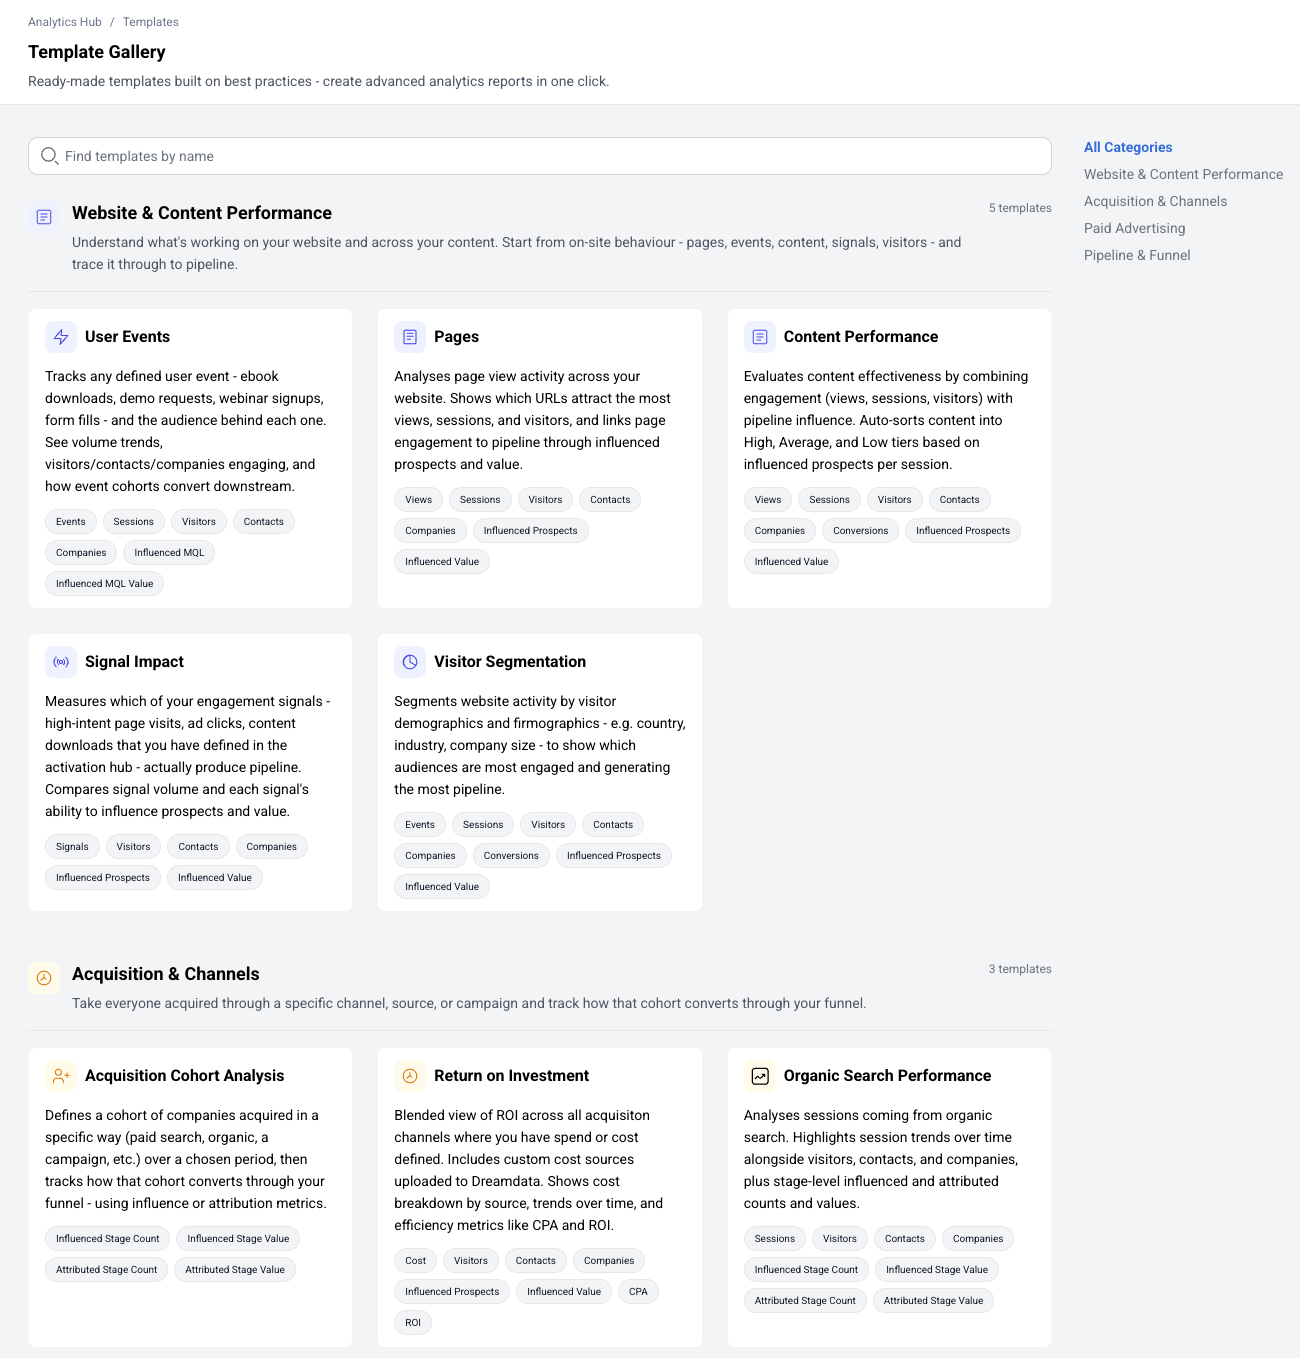
- The Template Gallery opens, with templates grouped into four categories: Website & Content Performance, Acquisition & Channels, Paid Advertising, and Pipeline & Funnel. Use the search box to find a template by name, or ask the Template Finder assistant for a recommendation.
Browsing Templates
The gallery displays templates as cards. Each card shows:
- Template name (e.g., "User Events," "Paid Ads Performance & ROAS," "Acquisition Cohort Analysis")
- Metric tags — The metrics included in the template (e.g., Cost, Visitors, Contacts, Companies)
- Icon — A visual indicator of the template's report type.
Viewing Template Details
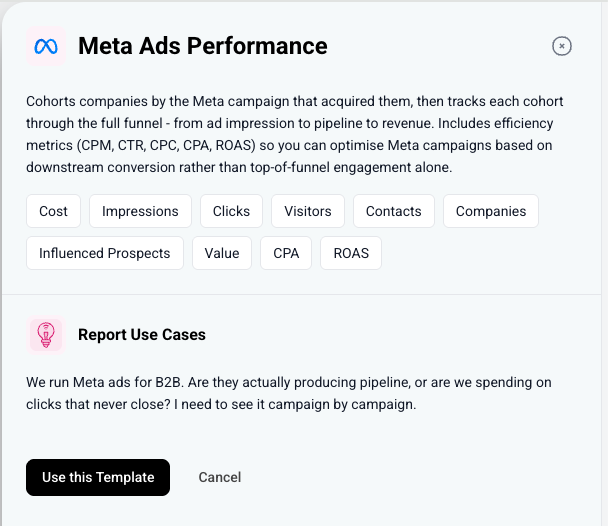
Click on a template card to see more details in a side panel:
- Description — What the template is designed to analyze
- Metric tags — The specific metrics included
- Use cases - Questions the template can help you answer
Using a Template
- Click on a template card to view its details.
- Click Use this Template to create a new report with the template's configuration pre-applied.
- The report opens with the configurator pre-populated. You can modify any settings before clicking Apply.
Templates are a starting point — you're free to add or remove metrics, change the date range, adjust filters, or modify any other setting after applying the template.
Available Templates
Template | Key Metrics | Best For |
Website & Content Performance | ||
User Events | Events, Sessions, Visitors, Contacts, Companies, Influenced MQL, Influenced MQL Value | Analyzing user engagement and event patterns |
Pages | Views, Sessions, Visitors, Contacts, Companies, Influenced Prospects, Influenced Value | Understanding page-level performance |
Content Performance | Views, Sessions, Visitors, Contacts, Companies, Conversions, Influenced Prospects, Influenced Value | Measuring content effectiveness; auto-sorts content into High, Average, and Low tiers |
Signal Impact | Signals, Visitors, Contacts, Companies, Influenced Prospects, Influenced Value | Evaluating which engagement signals actually produce pipeline |
Visitor Segmentation | Events, Sessions, Visitors, Contacts, Companies, Conversions, Influenced Prospects, Influenced Value | Segmenting website activity by demographics and firmographics |
Acquisition & Channels | ||
Acquisition Cohort Analysis | Influenced Stage Count, Influenced Stage Value, Attributed Stage Count, Attributed Stage Value | Tracking a cohort acquired a specific way through the funnel |
Return on Investment | Cost, Visitors, Contacts, Companies, Influenced Prospects, Influenced Value, CPA, ROI | Blended ROI across all channels where you have spend or cost defined |
Organic Search Performance | Sessions, Visitors, Contacts, Companies, Influenced Stage Count, Influenced Stage Value, Attributed Stage Count, Attributed Stage Value | Measuring organic search contribution to pipeline |
Paid Advertising | ||
Paid Ads Performance & ROAS | Cost, Visitors, Contacts, Companies, Influenced Prospects, Influenced Value | Tracking companies by the paid source that acquired them, with influenced and attributed pipeline |
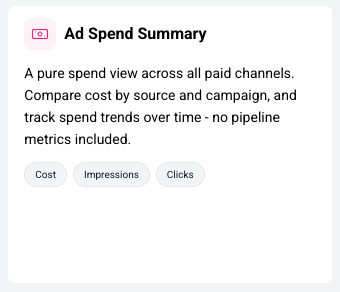
Ad Spend Summary | Cost, Impressions, Clicks | A pure spend view across paid channels (no pipeline metrics) |
Meta Ads Performance | Cost, Impressions, Clicks, Visitors, Contacts, Companies, Influenced Prospects, Value, CPA, ROAS | Meta (Facebook/Instagram) campaign-level deep-dive |
Google Search Ads Performance | Cost, Impressions, Clicks, Visitors, Contacts, Companies, Influenced Prospects, Value, CPA, ROAS | Google Search campaign and keyword deep-dive |
LinkedIn Ads Performance | Cost, Impressions, Clicks, Visitors, Contacts, Companies, Influenced Prospects, Value, CPA, ROAS | LinkedIn campaign-level deep-dive |
Pipeline & Funnel | ||
Stage Analysis | Stage Count, Stage Value, Conversion Rate, Average Days, Pipeline, Segmentation | Analyzing a funnel stage segmented by account or contact attributes (volume, value, velocity) |
Stage Attribution | Attributed Stage Count, Attributed Stage Value, Influenced Stage Count, Influenced Stage Value, Attribution | Attributing pipeline-stage entries across marketing touchpoints |
Creating a Report Without a Template
You don't have to use a template. To start from scratch:
- From the Templates page click Create from Scratch.
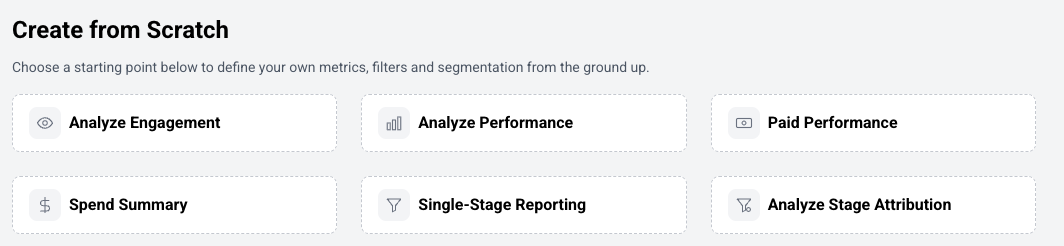
- Choose a report type directly.
- Configure the report manually using the configurator.
Tips
- Templates follow best practices and are designed to help you build advanced analytics reports quickly.
- If a template is close to what you need but not exact, use it as a starting point and customize from there.
- Each template belongs to a specific report type, which determines what configurator fields are available.