Revenue Reporting
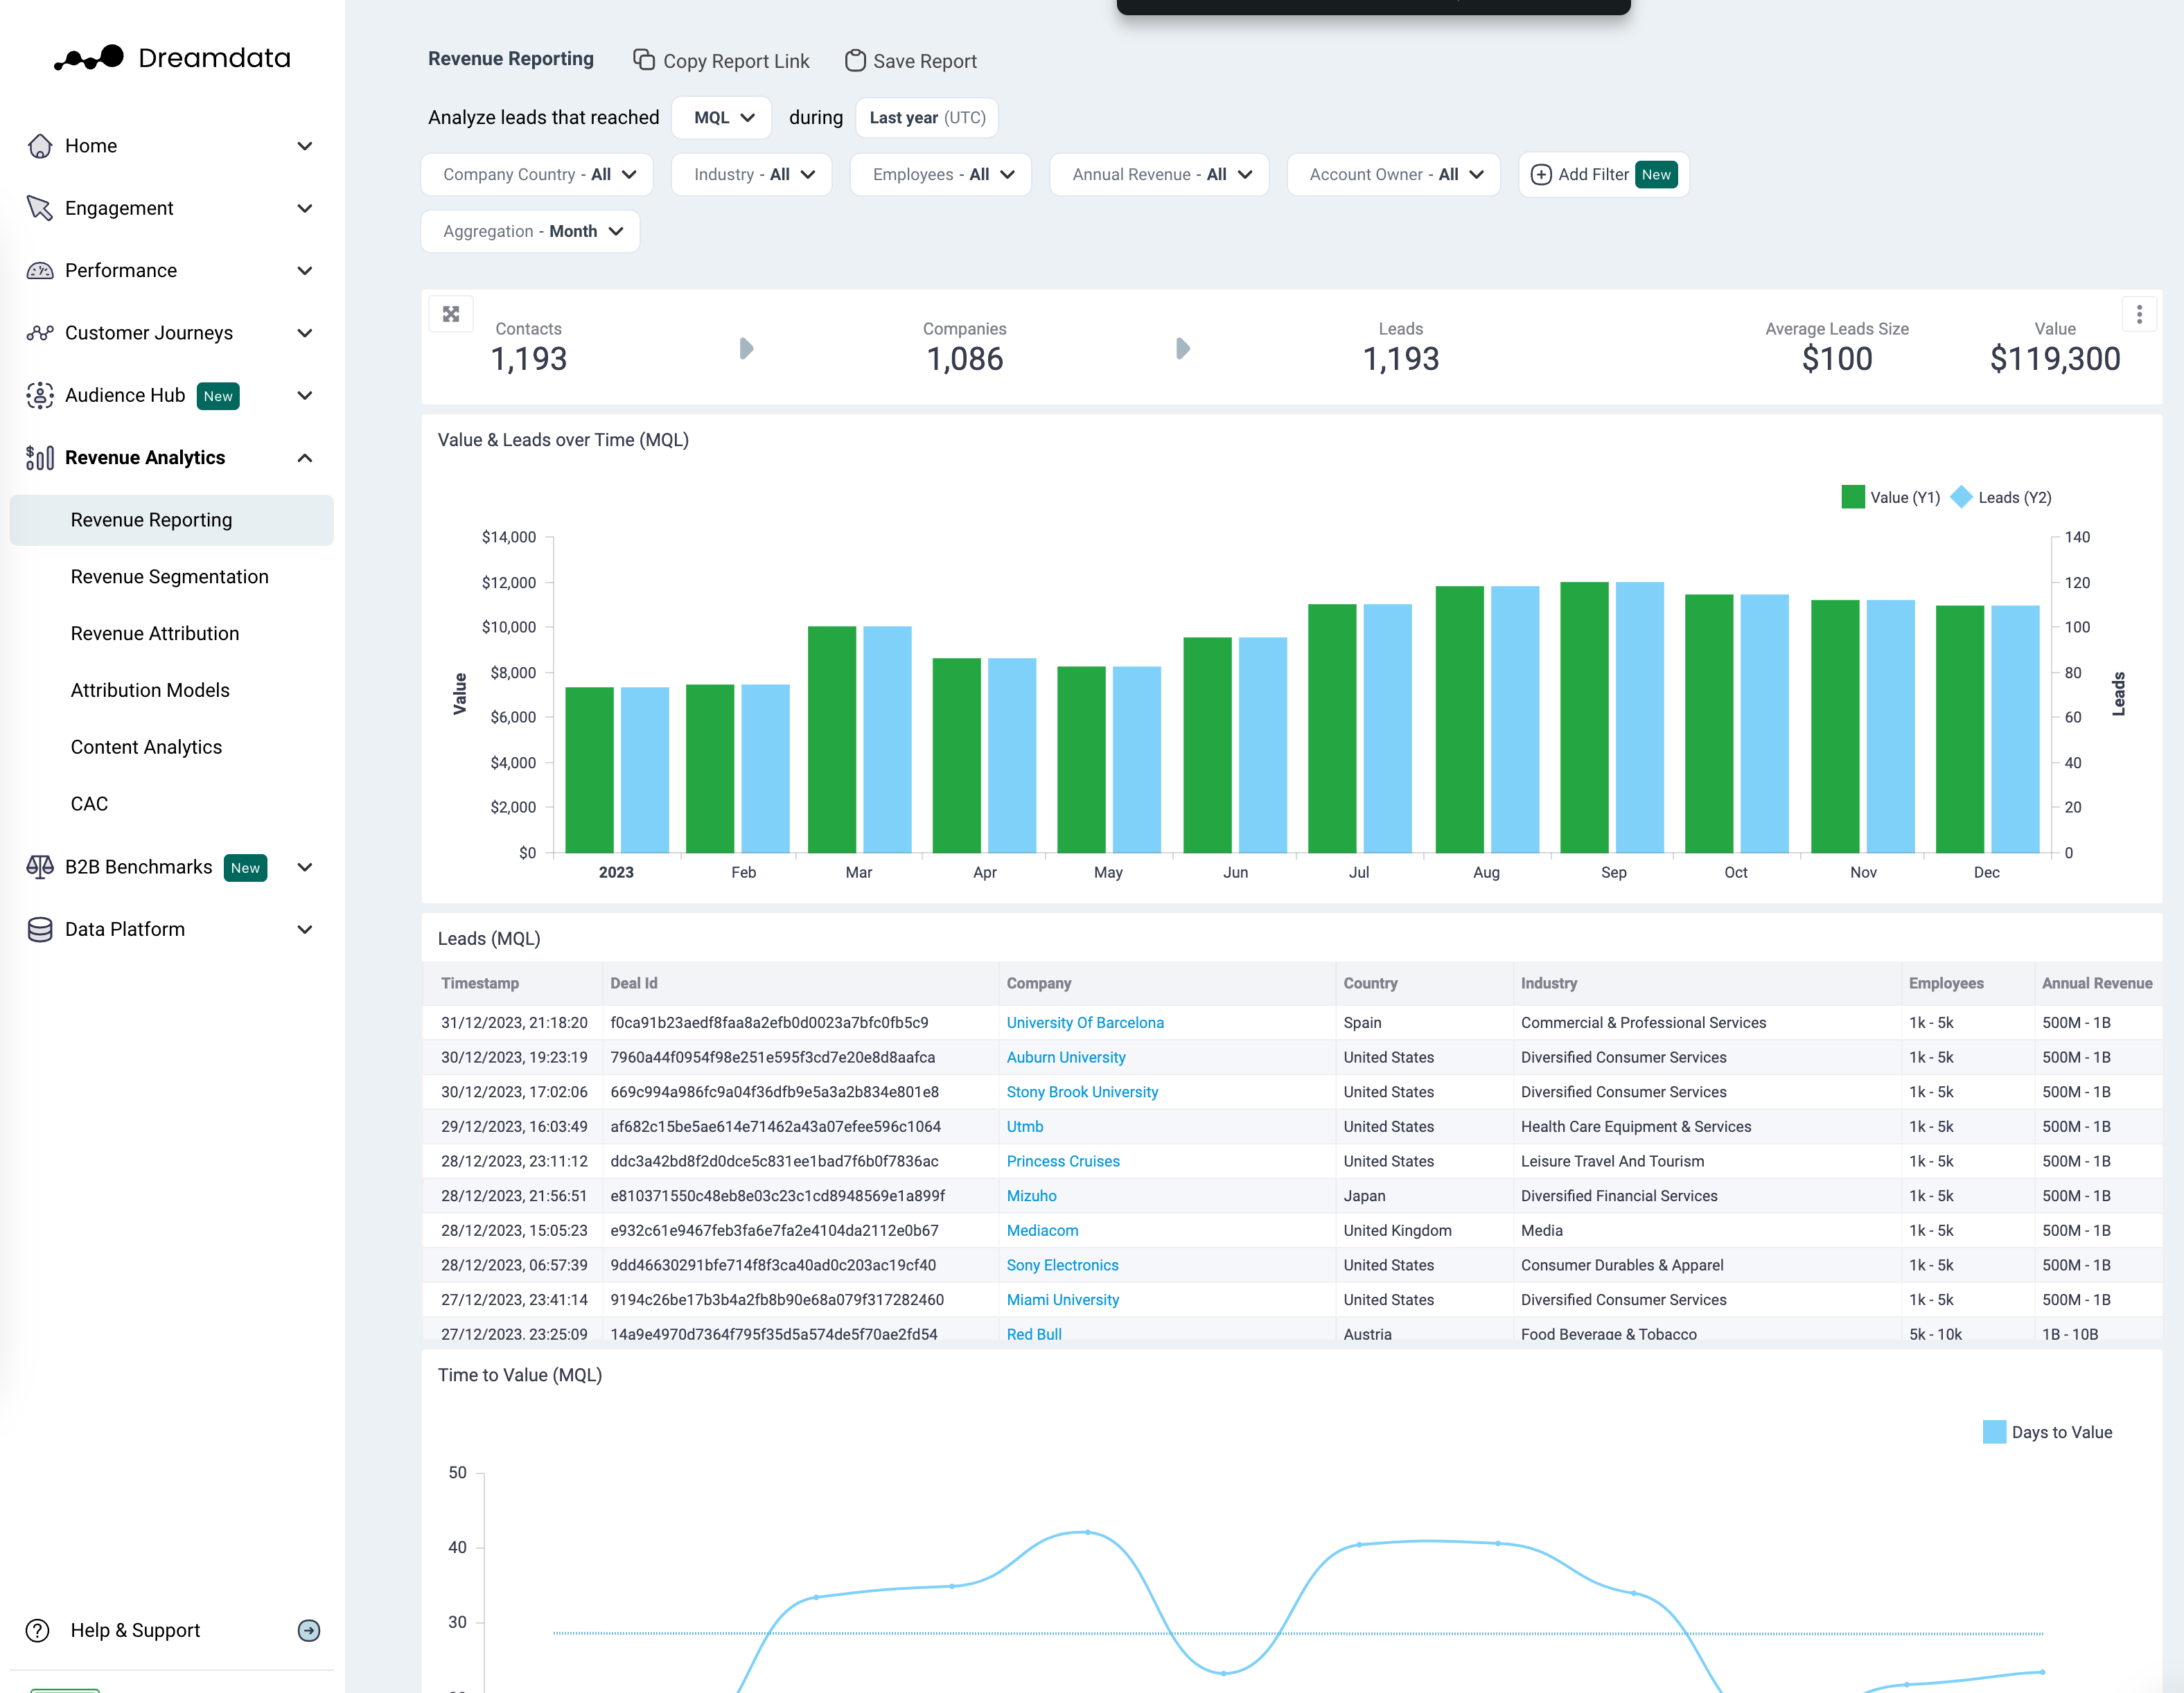
With this dashboard we provide an overview of your sales pipeline. Under each pipeline stage you can see how many: days, contacts, channels and sessions your company has collected.
Filters
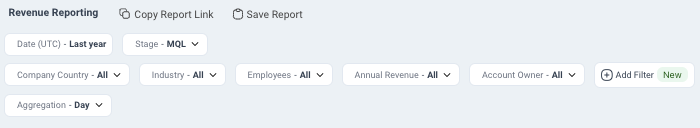
Date: Set the time period you want to investigate
Stage: You can select your preferred pipeline stage. Read more about the Free Tier Stages here
Country: Choose the country you want to analyse
Industry: Choose the industry you want to investigate
Employees: Segregate companies by the number of employees
Annual Revenue: Segregate companies by their annual revenue
Account Owner: Choose the account owner’s accounts you’d like to view
Aggregation: Set the time frame you wish your data to be displayed as
Metrics

Contacts: The number of visitors who we have been able to attach an email to their user id
Companies: The number of companies who are attached to Contacts, or the number of companies in your CRM who we can be attached to any visitor traffic (anonymous)
Deals: The number of deals who we have been able to identify as your selected stage (sign up, opportunity created or opportunity won)
Average Deal Size: Value divided by Deals
Value: The amount of revenue that is attributed by your chosen Stage. It will show basic value estimation of sign up, expected revenue of deal created or actual revenue of deal won, taken from your CRM
Graphs and Tables
Value and Deals over Time
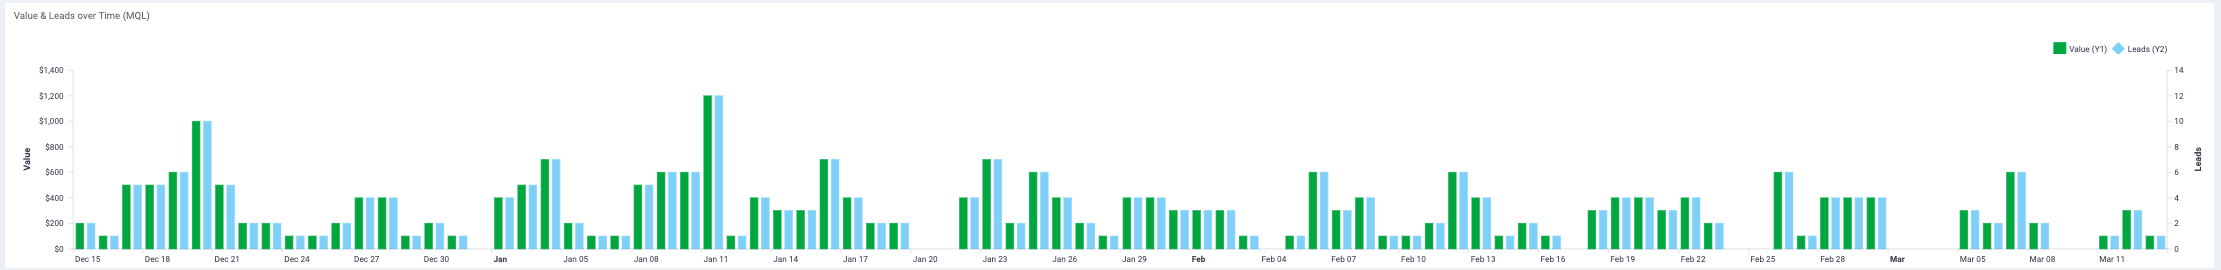
In this graph we provide information on your business outcomes based on the Stage model. This data visualisation helps to notice which time frameworks were the most successful to your company based on value and deal generation. Use the Aggregate filter to breakdown the X-Axis as you wish e.g. (day, week, month).
Deals
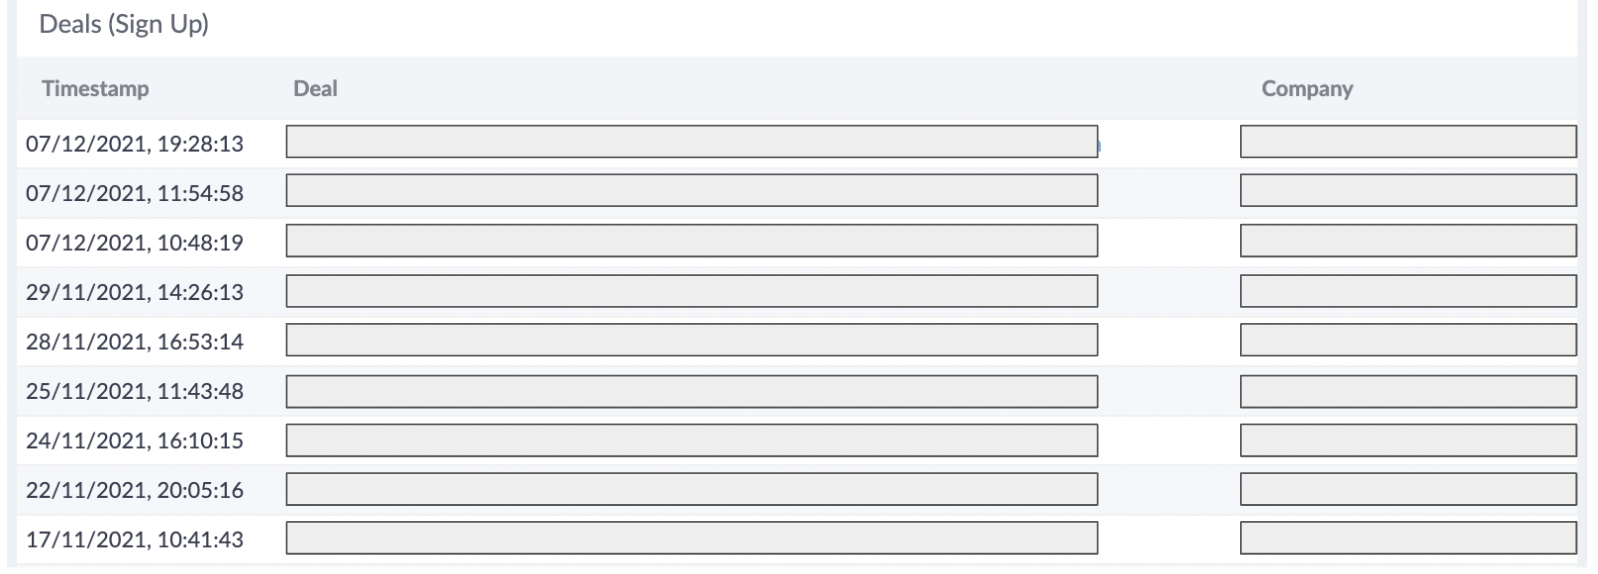
This table displays your individual deals based on your chosen Stage (sign up, opportunity created, opportunity won). By clicking on the shown data you will be directed to the unique customer journey.
Time to Value
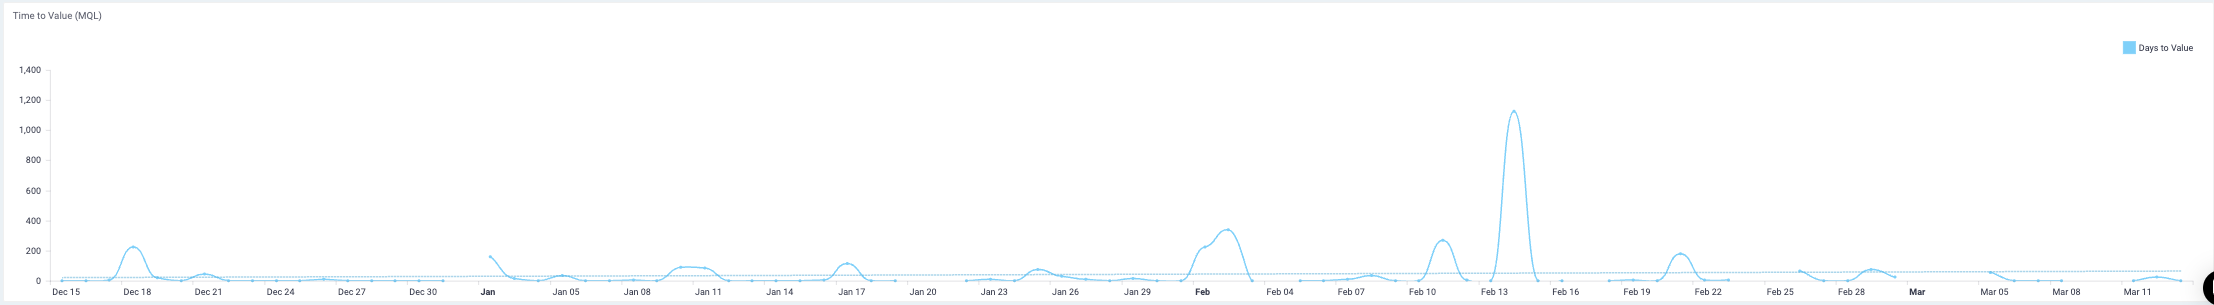
This graph will show the average days needed to achieve the deals of your chosen Stage. It also can be used as KPI for budgeting.