Signal Impact Report

Understanding Signal Impact
The Signal Impact report in Dreamdata allows you to measure how signals influence deals and value in your pipeline. Understanding signal impact is crucial because it enables you to optimize your spend and revenue, when customers indicate they are ready to engage further, make a purchase, upgrade, downgrade, or potentially churn.
Features of the Report
- Outcome options: The report enables you to analyze signal impact on any of business outcome (stage) you have set up in Dreamdata.
- Filters & Segmentation: Analyze data based on properties of signals, visitors, contacts, and companies and more. The report offers 14 filters and 18 segmentation options, allowing for highly customizable analysis.
- Time-based Aggregation: View data by day, week, month, quarter and year to identify trends.
- Group By Options: Analyze data based on properties of signals, visitors, contacts, and companies and more. The report offers 18 segmentation options.
- Graphical Representation: Visualize influenced leads and value over time with clear charts.
.
How to use the report
- Start by selecting the time period of when the signals were triggered.
- Thereafter select the business outcome (stage) you want analyze for which you want to analyze impact.
- Finally select any filters to apply, and how to segment the report.
..
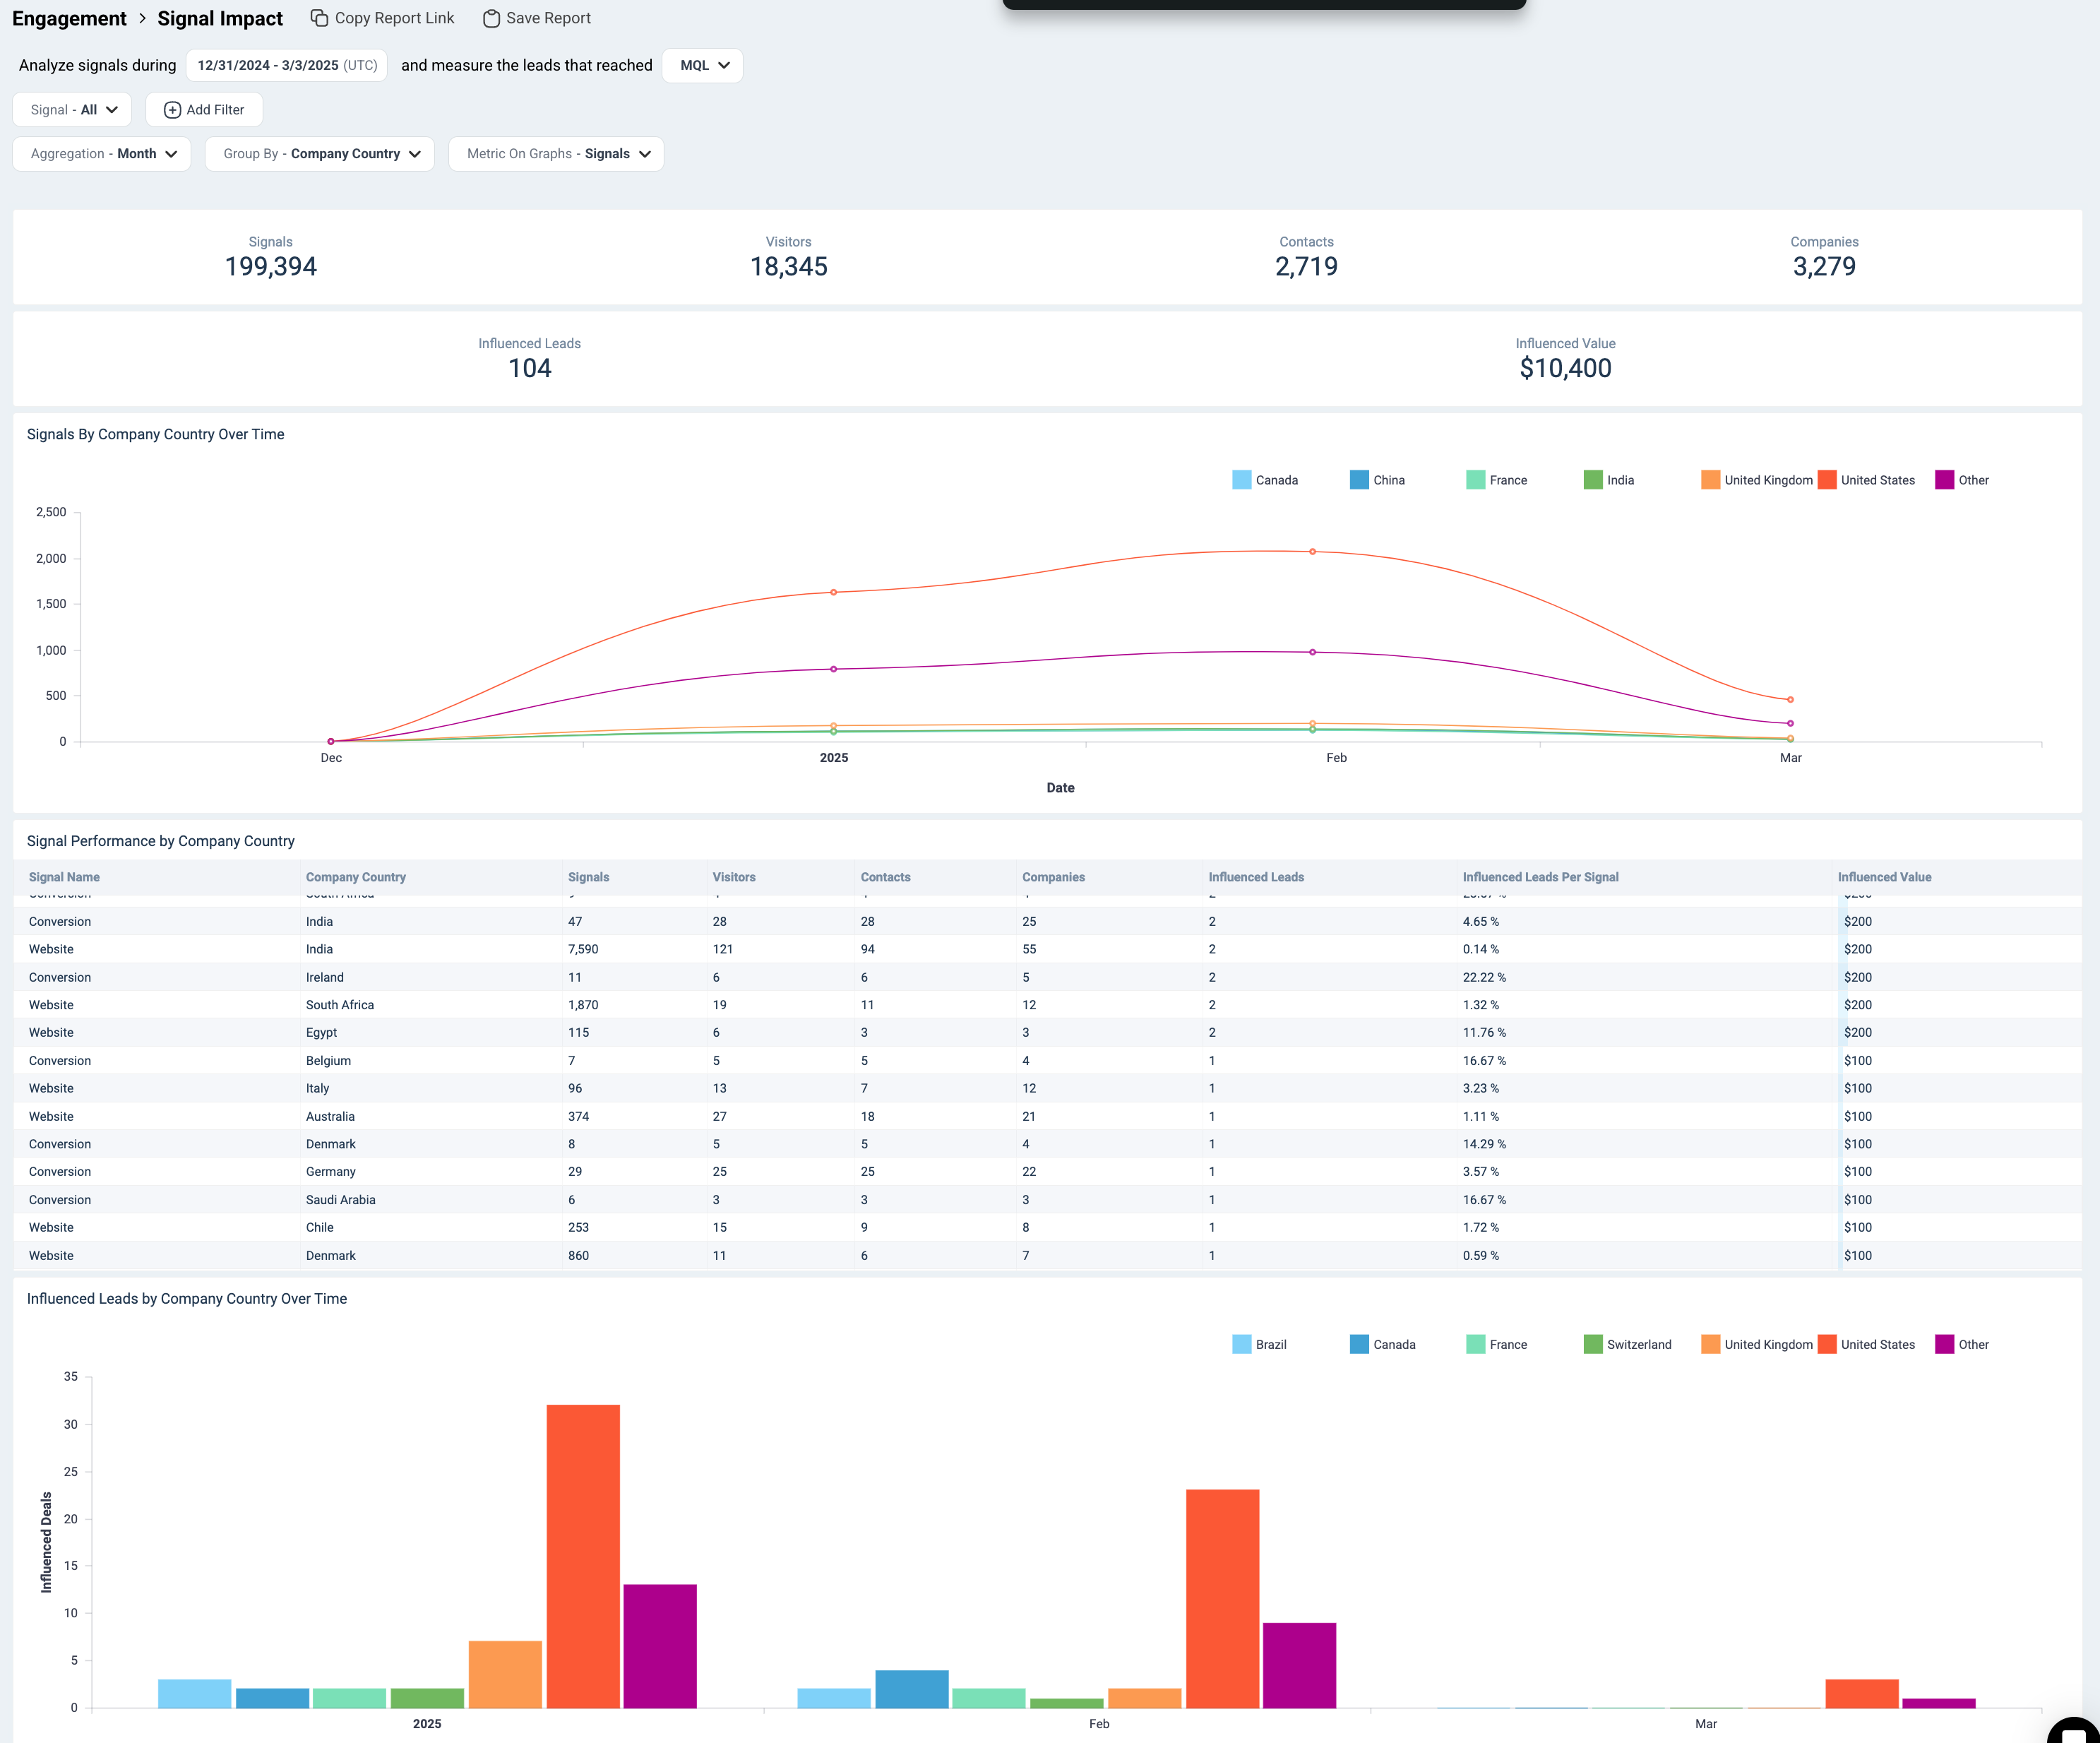
Key Metrics Displayed
- Signals: Total number of recorded signals.
- Visitors: Number of unique visitors associated with the signals.
- Contacts: Number of identified contacts.
- Companies: Number of companies engaged.
- Influenced Leads & Value: The number and monetary value of leads influenced by the signals..
.
Use Cases
The goal is to understand signal-influence and take the right action based on the type of signal being analyzed. For instance, if a signal strongly indicates customer interest, creating a Dreamdata audience and syncing it with your preferred ad platform would be a smart move. Conversely, if a signal suggests a customer is at risk of churning, alerting your sales or customer success team is likely the best course of action.
- Sales Performance Analysis: Identify which signals contribute the most to closing deals. Create a Dreamdata Audience and sync it to your preferred ABM ad platform to optimize success when closing deals. Read about creating an audience here.
- Marketing Optimization: Assess which signals influence most early stage leads and value. Then create a Dreamdata Audience and sync it to your preferred ad platform (LinkedIn, Google, etc.) to optimize your ad spend. Read about creating an audience here.
- Churn prevention Analysis: If you have identified strong signals indicating churn risk, alert your sales and customer success teams to take appropriate actions.
.