Revenue Segmentation
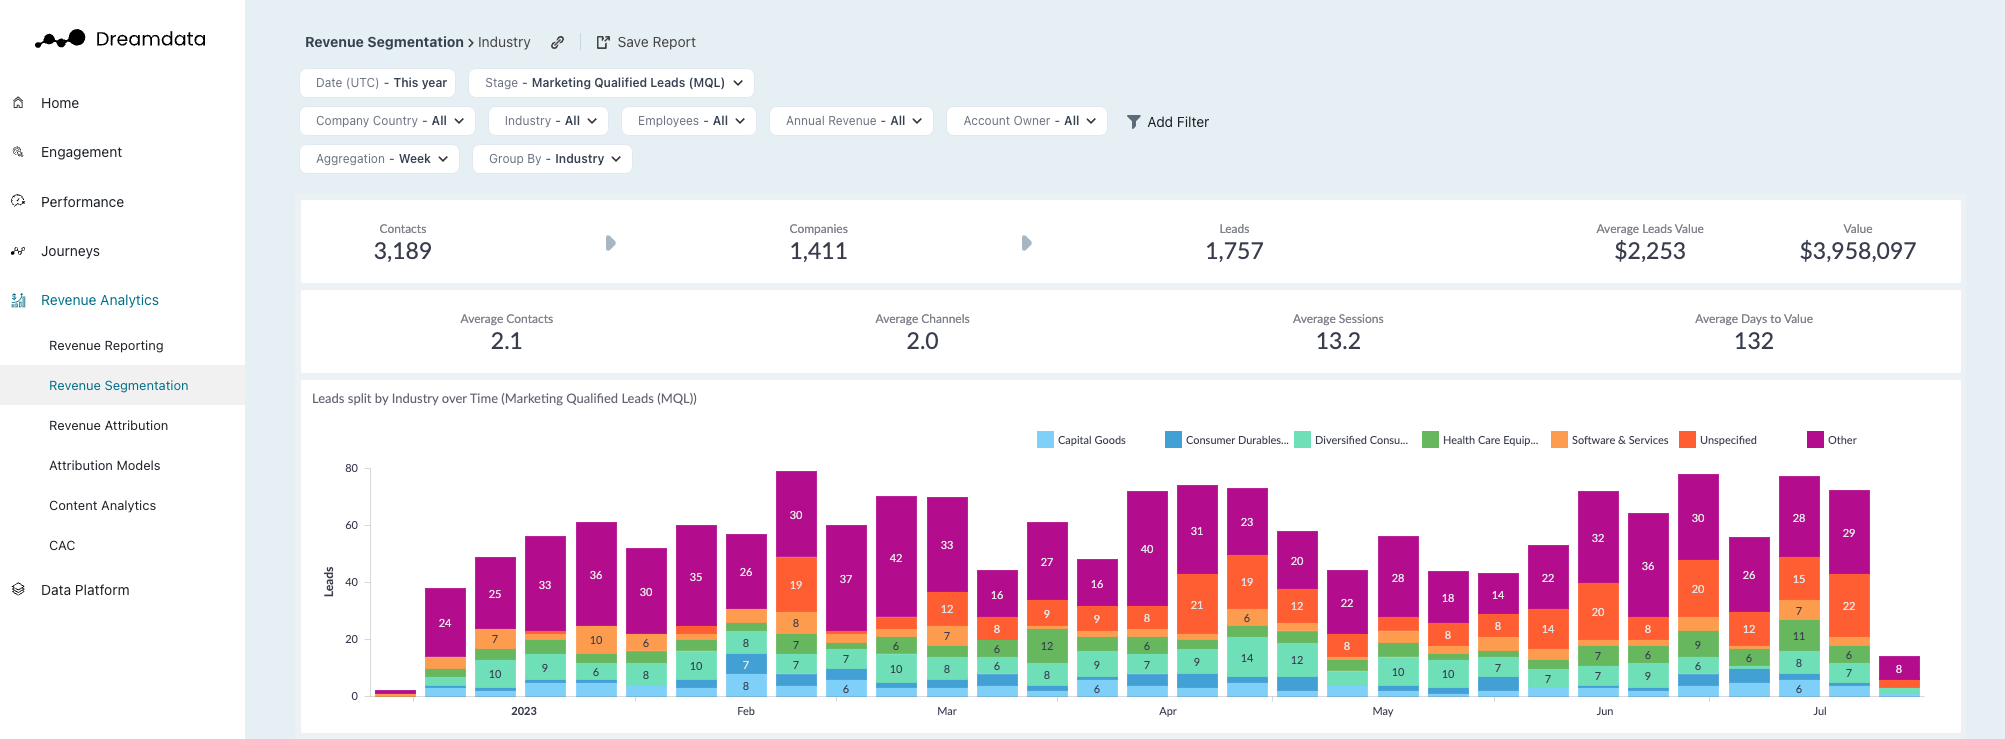
This dashboard will provide you with all necessary filters to segment your contacts. Choose the funnel stage you want to investigate and group it by similar characteristics. This information helps to identify and group your target audience when setting up ads.
Filters
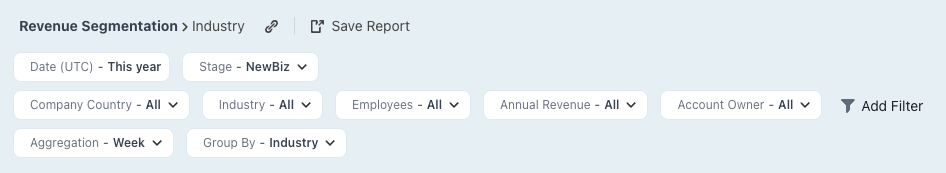
Date: Set the time period you want to investigate
Stage: You can select your preferred pipeline stage. Read more about the Free Tier Stages here
Company Country: Choose the country you want to analyse
Industry: Choose the industry you want to investigate
Employees: Segregate companies by the number of employees
Annual Revenue: Segregate companies by their annual revenue
Account Owner: Choose the account owner’s accounts you’d like to view
Aggregation: Set the time frame you wish your data to be displayed as
Grouped by: Choose certain options to see how it affects your deals
- Industry
- Company Country
- Account Owned
- Employees
- Annual Revenue
- Days to Revenue
- Deal Size
- First Touch Channel
Metrics
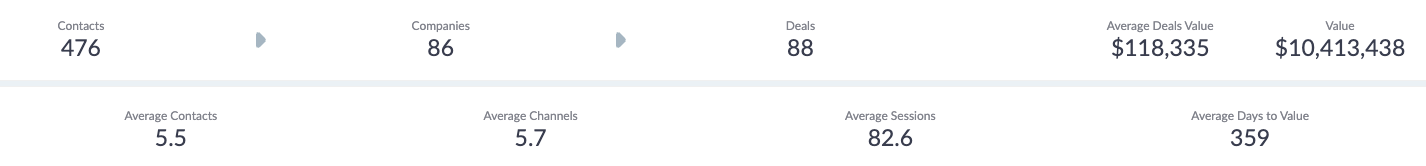
Contacts: The number of visitors who we have been able to attach an email to their user id
Companies: The number of companies who are attached to Contacts, or the number of companies in your CRM who can be attached to any visitor traffic (anonymous)
Deals: The number of deals who we have been able to identify as your selected stage (sign up, opportunity created or opportunity won)
Average Deal Size: Value divided by Deals
Value: Depending on your chosen stage it will show - basic value estimation of sign up, expected revenue of deal created or actual revenue of deal won, taken from your CRM
Average Contacts: The average number of visitors who we have been able to attach an email to their user id
Average Channels: The average number of different Channels (paid, direct, referral..) that potential customers come from.
Average Sessions: The average number of user sessions that took place within the given time period
Average Days to Value: The average number of days needed to complete a certain conversion
Graphs and Tables
Deals split by Industry over Time
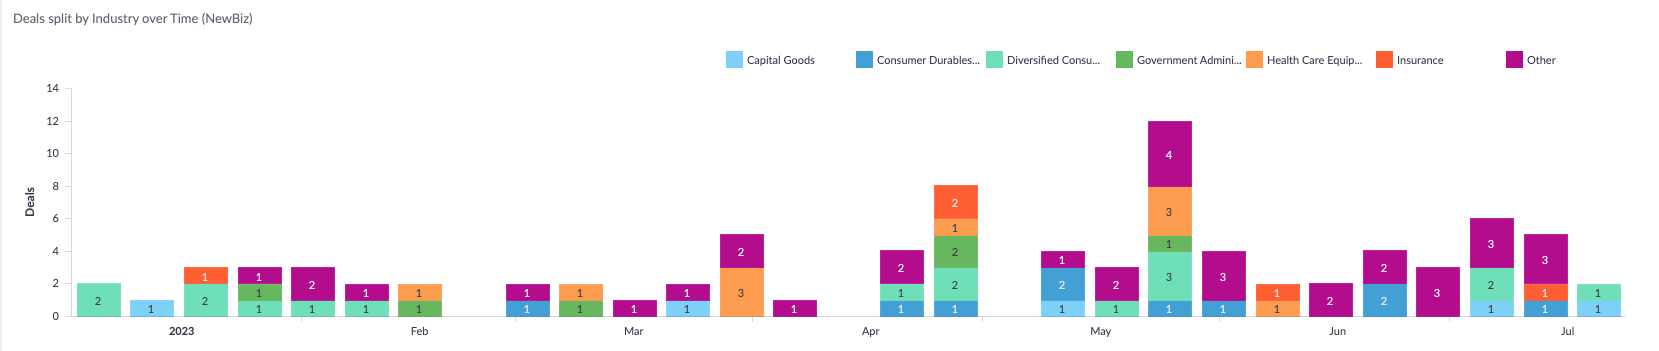
With this graph we will inform you about the origin of the deals over a certain time frame. This graph is used for industry comparison in relation to deal generation.
Note: This Graph is used for a quick overview of Deals generated via different Industries (split by your chosen Group By filter). Change filter to display: countries, deal sizes, etc.
Value and Deals by Industry
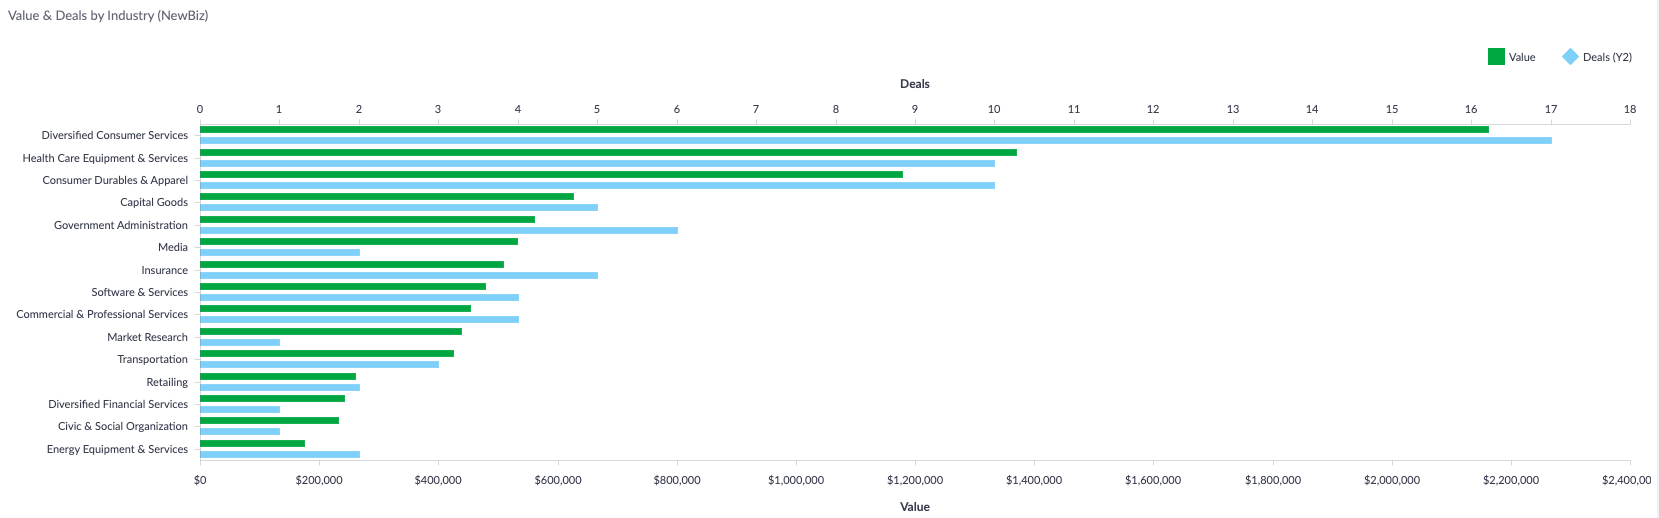
This graph will show industry statistics based on your chosen Stage. These statistics are displayed as Deals and Value split by Industry.
Note: This Graph is used for a quick overview of Value over Deals generated via different Industries (split by your chosen Group By filter). Change filter to display: countries, deal sizes, etc.
Performance by Industry
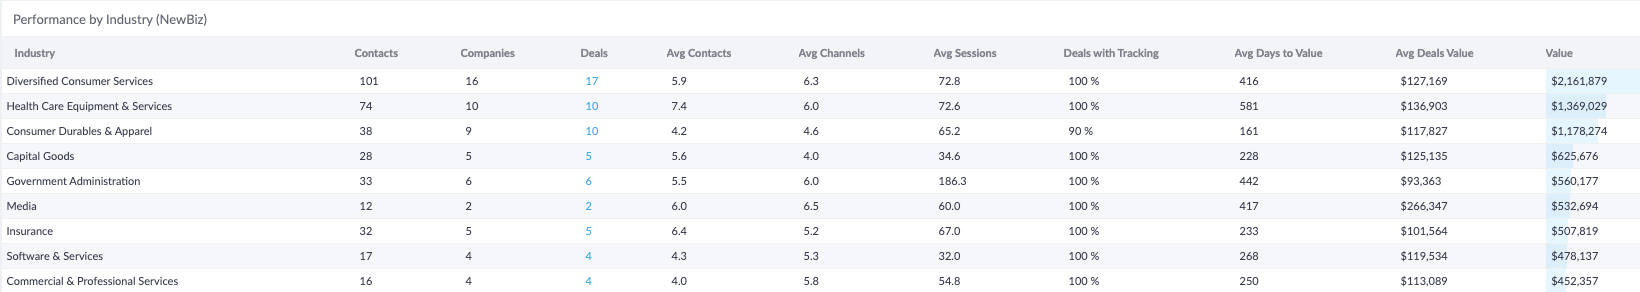
In this table your Contacts data is split by Industry. By clicking on Deals you will be directed to the deals feature, where you will be able to find individual Deals and their respective Customer Journeys.
Performance by Country
This report shows where your campaign click events happen, and which regions bring more value than others.
Performance by Account Owned
This report shows the overall performance of your account owners and value created, in the given stage.
Performance by Employees
This report shows which employee intervals your contacts are assigned to, and which employee intervals have more Value than others.
Performance by Annual Revenue
This report shows which annual revenue intervals your contacts are assigned to, and which annual revenue intervals have more Value than others.
Performance by Days to Revenue
This report shows which days to revenue intervals your contacts are assigned to, and which days to revenue intervals have more Value than others.
Performance by Deal Size
This report shows which deal size intervals your contacts are assigned to, and which deal size intervals have more Value than others.
Performance by First Touch Channel
This report shows which first touch channels have been used by your contacts, and which first touch channels bring more Value than others.
Note: You can open a larger view by clicking on the performance title in the top left corner.
Value split by Industry over Time
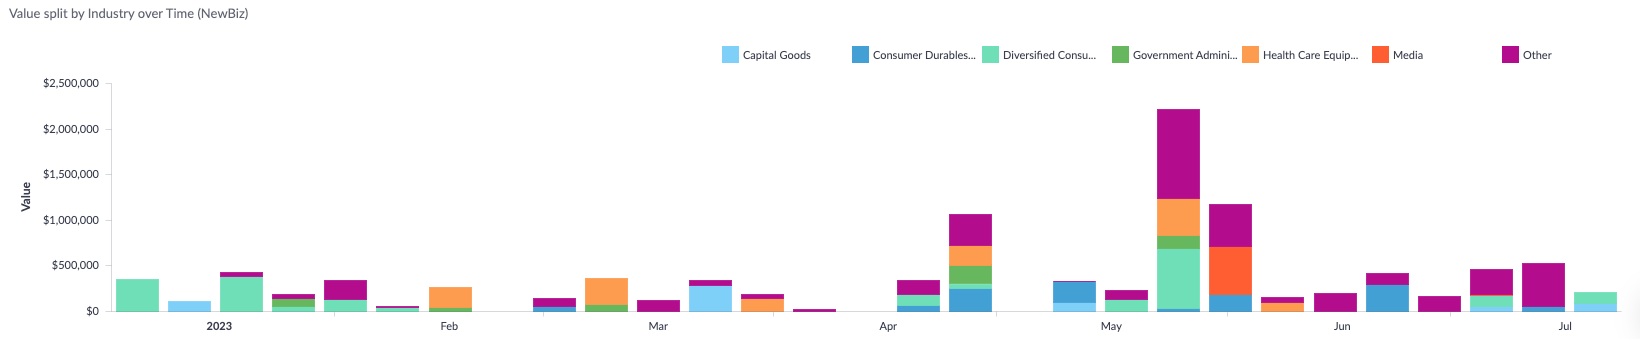
With this graph we will inform you about the origin of the value over a certain time frame. This graph is used for industry comparison in relation to value generation. Remember that the sign up stage shows basic value estimation, opportunity created shows expected value, opportunity won shows actual value (revenue).
Note: This Graph is used for a quick overview of Value generated via different Industries (split by your chosen Group By filter). Change filter to display: countries, deal sizes, etc.
Deals split by Industry over Time
With this graph we will inform you about the origin of the deals over a certain time frame. This graph is used for industry comparison in relation to deal generation.
Note: This Graph is used for a quick overview of Deals generated via different Industries (split by your chosen Group By filter). Change filter to display: countries, deal sizes, etc.