LinkedIn Ads
 Updated
by
Aiting
Updated
by
Aiting
In this article, we’ll walk you through the LinkedIn Ads report, covering the essentials surrounding it.
With the LinkedIn Ads report, you can:
- Measure how ads perform specifically regarding generated revenue, rather than just clicks or impressions.
- Drill down from a high-level funnel overview into specific ad set-level metrics to make data-supported strategy decisions.
Setting up LinkedIn Ads. Click here.
Access and permission to LinkedIn Lead ads. Click here.
Filters Configuration
Filters are available at the top of the report to customize the data view:
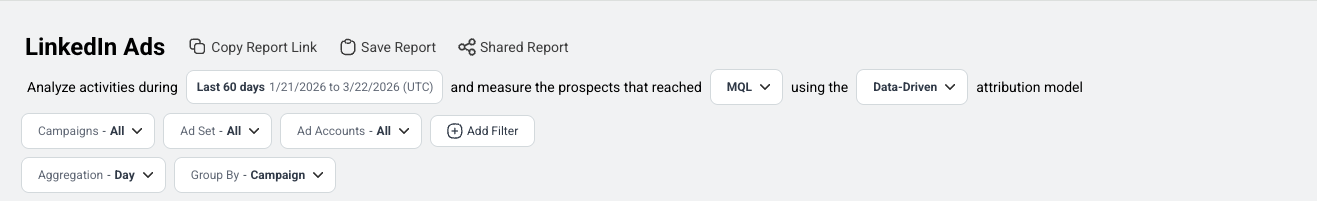
What are the filter options?
- Date Range: Sets the specific time period for the analysis (e.g., "Last Year" or "Last 30 Days").
- Stage: Filters the pipeline data to show only leads that reached a specific stage (e.g., MQL, SQL).
- Attribution: Selects the attribution model used to assign credit to touch points. Available models include:
- First Touch
- Last Touch
- Linear
- U-Shaped
- W-Shaped
- Data-driven
- Custom attribution models
- Campaigns: Filters by specific campaign(s).
- Ad Sets: Filters by specific ad set(s).
- Ad Accounts: Filters by specific connected ad account(s).
- Aggregation: Sets the time frames for the graphs (e.g., display data by Week, Month, or Quarter).
- Group By: Determines how the table rows are organized. Options include:
- Ad Set: Rows represent individual ad sets.
- Campaign: Rows represent aggregate campaigns.
- Ad Account: Rows represent account-level totals.
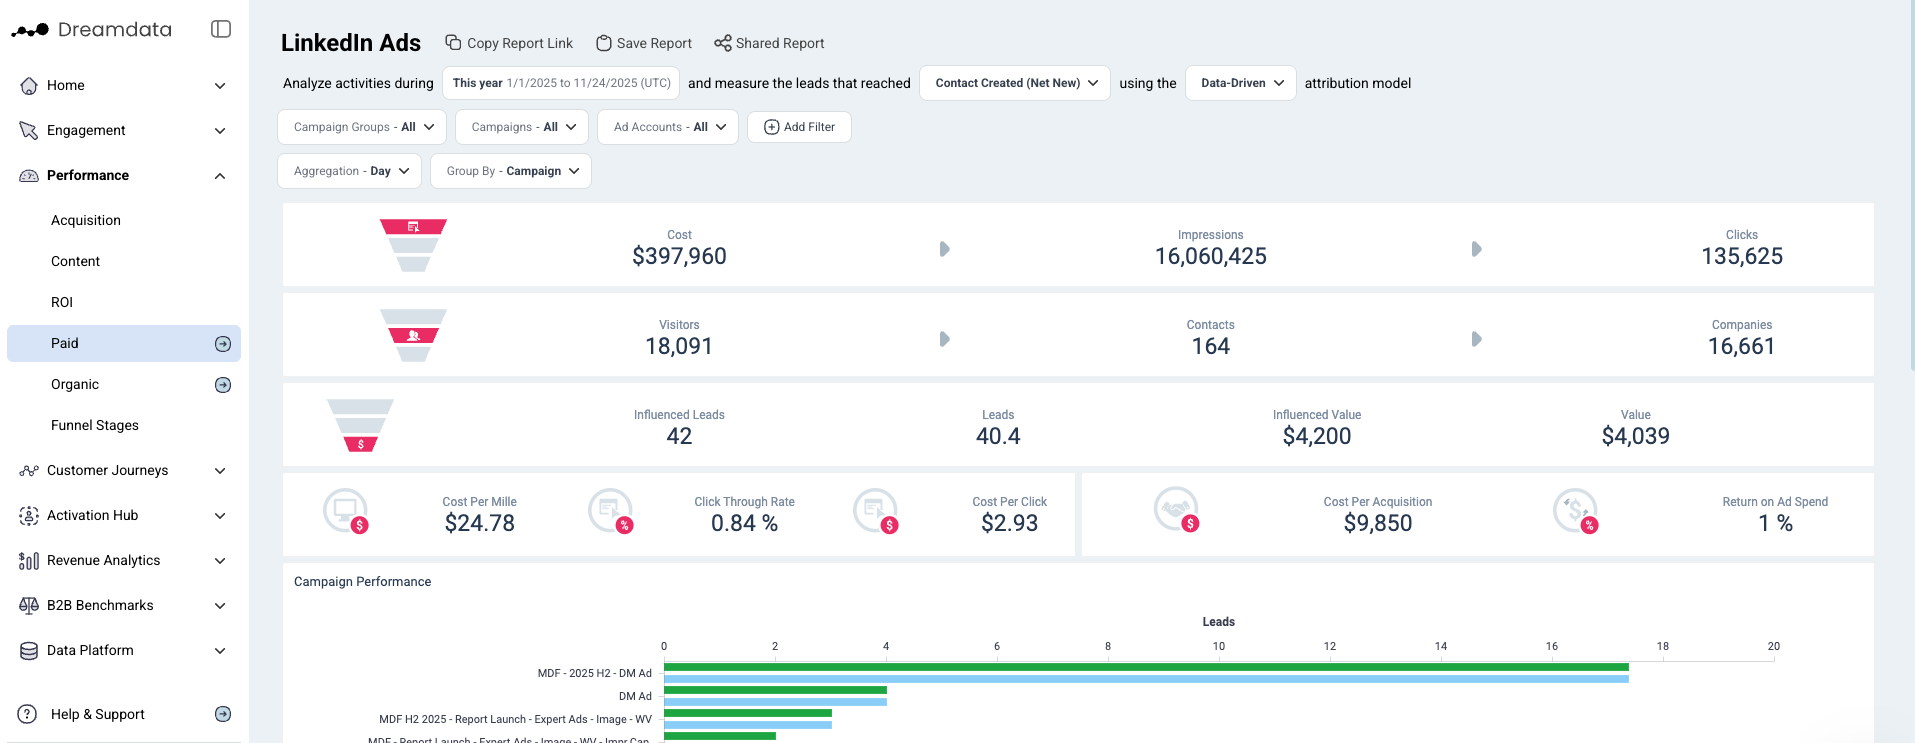
Funnel Overview
The Funnel Overview is located below the filters, displaying a drill-down from a high-level funnel overview into specific ad set-level metrics.
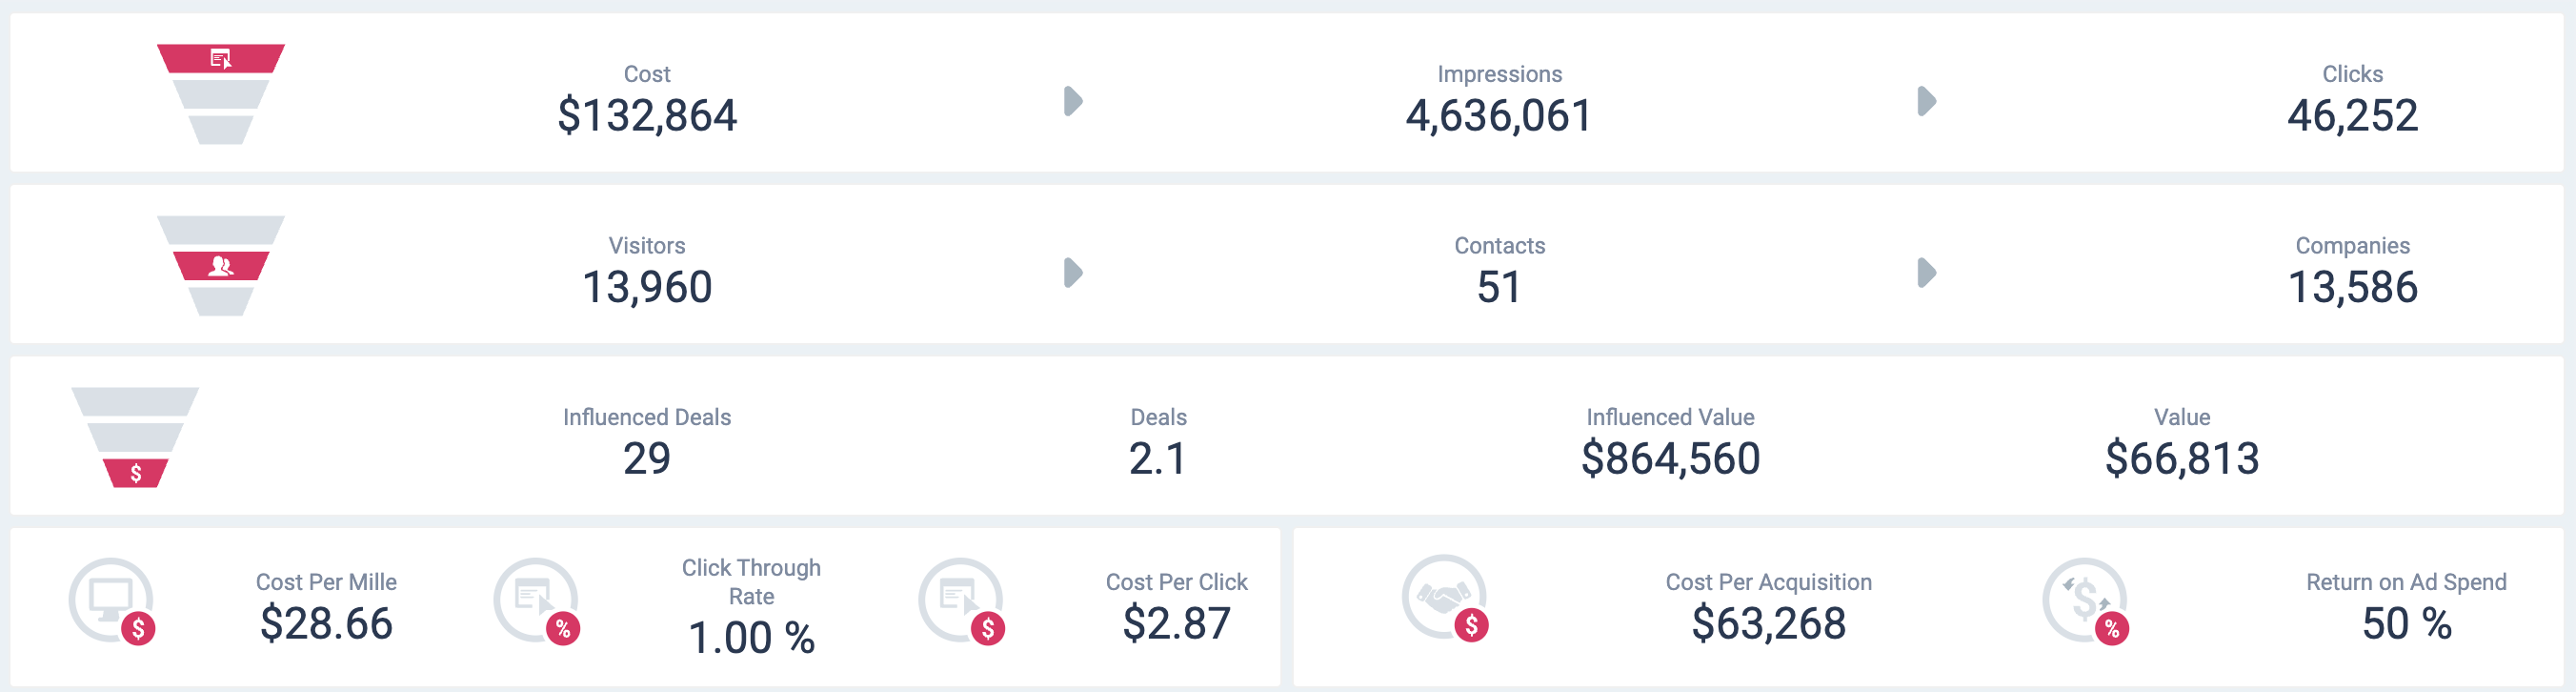
What does each metric mean?
- Cost: The total spend on LinkedIn Ads.
- Impressions: An impression is the number of times your LinkedIn ads are shown. Each time your ad appears on someone's feed, it is counted as an impression.
- Clicks: Chargeable clicks. Learn more about chargeable clicks here.
- Visitors: Unlike other ‘Visitor’ numbers in Dreamdata, this number includes two sources:
- Unique users who had a website session that originated from LinkedIn Ads.
- Anonymous engagement with ads on the LinkedIn platform that has more than 3 engagements.
- Contacts: The number of visitors for whom we have been able to attach an email to their User ID.
- Companies: The number of companies attached to Contacts, or the number of companies in your CRM that can be attached to any visitor traffic or engagement on the LinkedIn platform (anonymous).
- Cost per Mille (CPM): Cost per thousand. This calculation is used to denote the price over 1,000 impressions.
- Click-Through Rate (CTR): Clicks / Impressions.
- Cost Per Click (CPC): Total Cost / Clicks.
- Cost Per Acquisition (CPA): Total Cost / Attributable Deals.
- Return on Ad Spend (ROAS): Total Attributable Revenue / Total Cost.
What does each funnel section provide?
- Cost → Impressions → Clicks
In this first section, we provide the top of the funnel for your LinkedIn Ads for the given time period. This data is pulled directly from LinkedIn Ads through our integrations. - Visitors → Contacts → Companies
In the second section, we provide an overview of the traffic from LinkedIn Ads, which is based on the tracking script installed on your website. - Influenced Deals, Deals, Influenced Value, Value
In the third section, we provide the total number of Influenced/Attributed Leads and Influenced/Attributed Value that can be assigned to LinkedIn Ads based on the selected filters.Note: The term "Leads" may vary depending on the stage you're analyzing. To read more about Influenced vs. Attributed Leads and Value, Click here. - Cost per Mille, Click-Through Rate, Cost Per Click → Cost Per Acquisition → Return on Ad Spend
In the fourth section, we provide percentages for some common KPIs, most importantly Return on Ad Spend.
Graphs and Tables
The data displayed in the charts and tables below changes dynamically based on your selection in the Group By filter.
Performance Summary
Use this section to compare the high-level ROI and engagement success of your marketing efforts on LinkedIn.
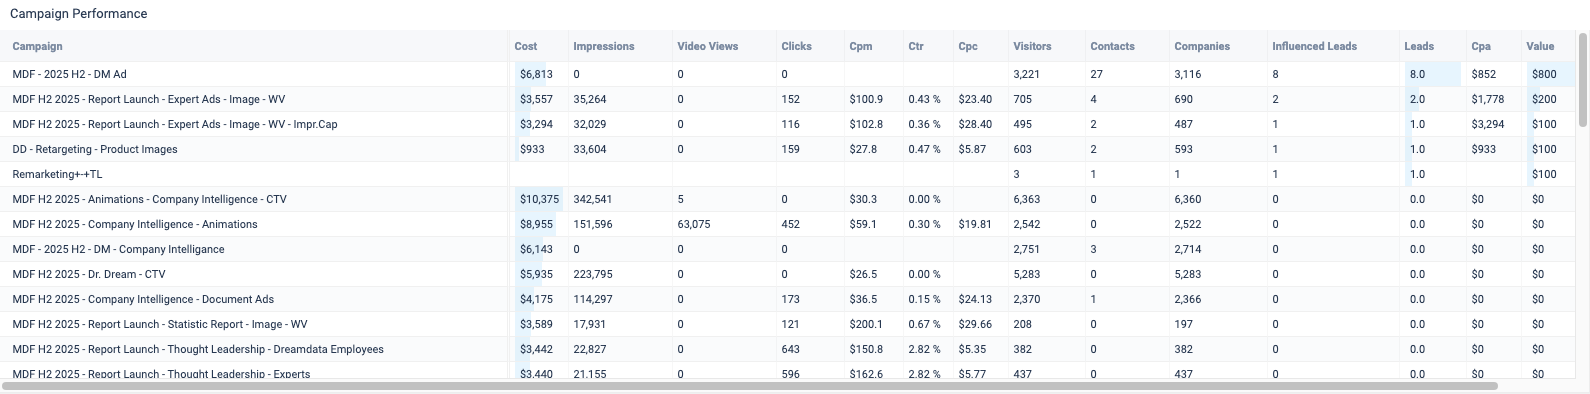
Performance Details
A detailed data grid allowing for granular analysis. Use this table to correlate spending with downstream funnel results.
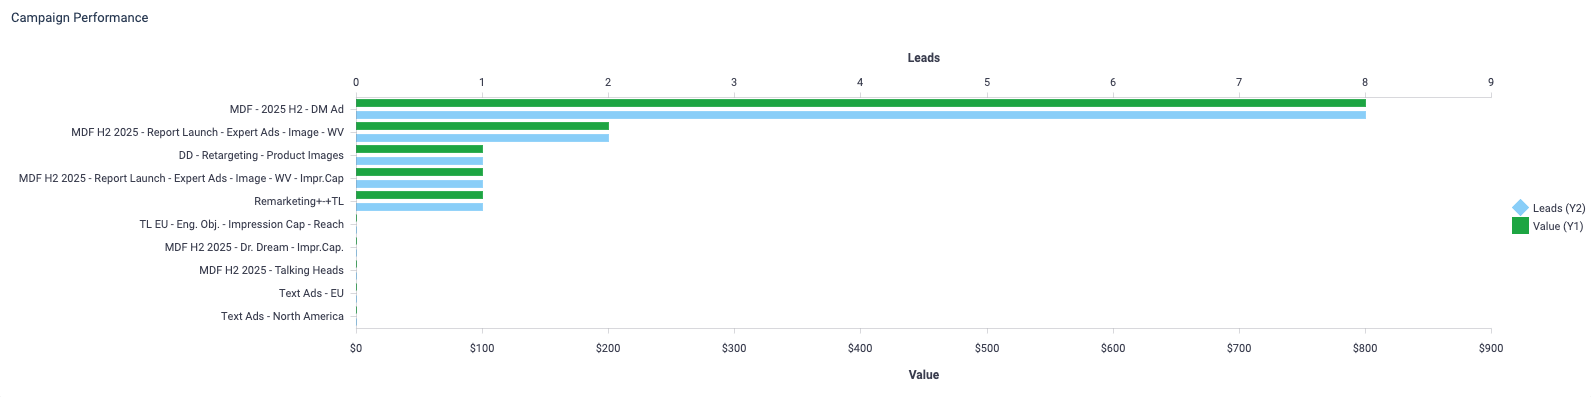
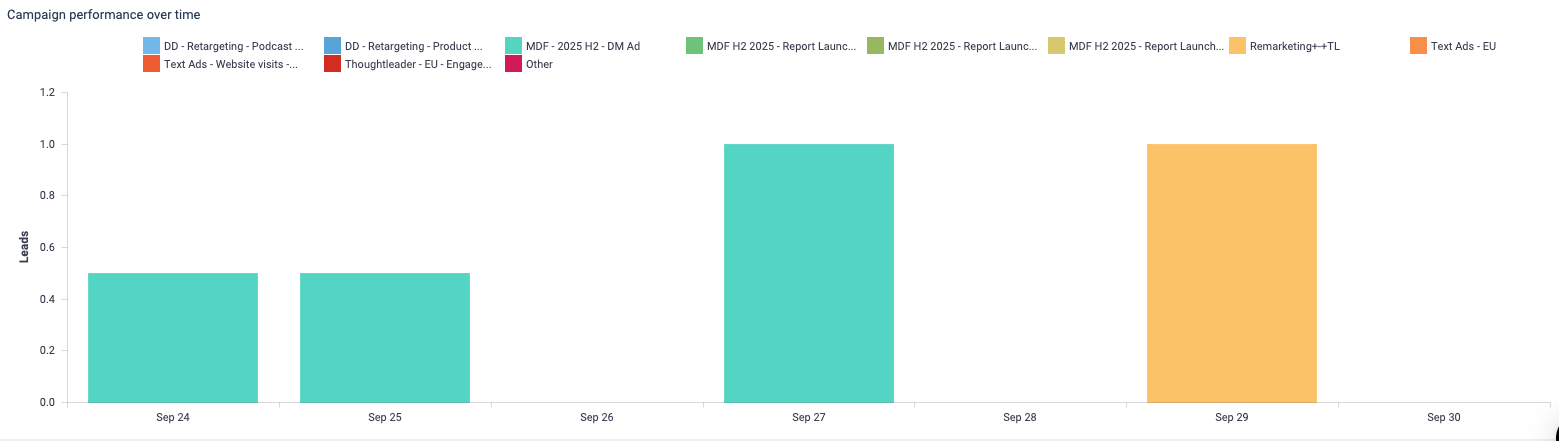
Performance Over Time
We provide a graph showing the development of your LinkedIn Ad Campaigns and their generated deals over the time period specified in your Filters. Use the Aggregate filter to break down the X-Axis as needed (e.g., day, week, month).
This graph makes it easy to see which ad set is performing best, but it also shows how long it generally takes for an ad set to win deals. To do that, select a specific Ad Set and set the Aggregation Filter to "days." This will allow you to get a detailed analysis of unique ad sets.
FAQ
Why is there a discrepancy between clicks and visitors?
A visitor will only be counted when they click through to your website and identify themselves.
Clicks will normally be higher than visitors due to circumstances such as:
- The page didn't load after a person entered it and then closed the page.
- The person chose not to accept cookies and thus opted out of our tracking.
If that's the case, you should follow this guide and make sure you use the correct ad set and
ad_set_id.How are the numbers for Leads and Value calculated?
To calculate these numbers, we first look at the pool of contacts/companies that visited via a LinkedIn Ad based on the dates/filters. Once we have that group, we see what deals were closed after their visit, up to today's date.
More importantly, we are only looking at deals where we have a recorded history of sessions: Attributable Deals.
This pool of attributable deals will make up the basis for this section. For each of these deals and all their sessions, we will run the Attribution Model you have selected so each session is given a deal and revenue amount.
For both Attributable Deal and Value (revenue), we then provide the sum of these amounts for each session that contains a LinkedIn Ad, depending on which Attribution Model you have selected.