YouTube Ads
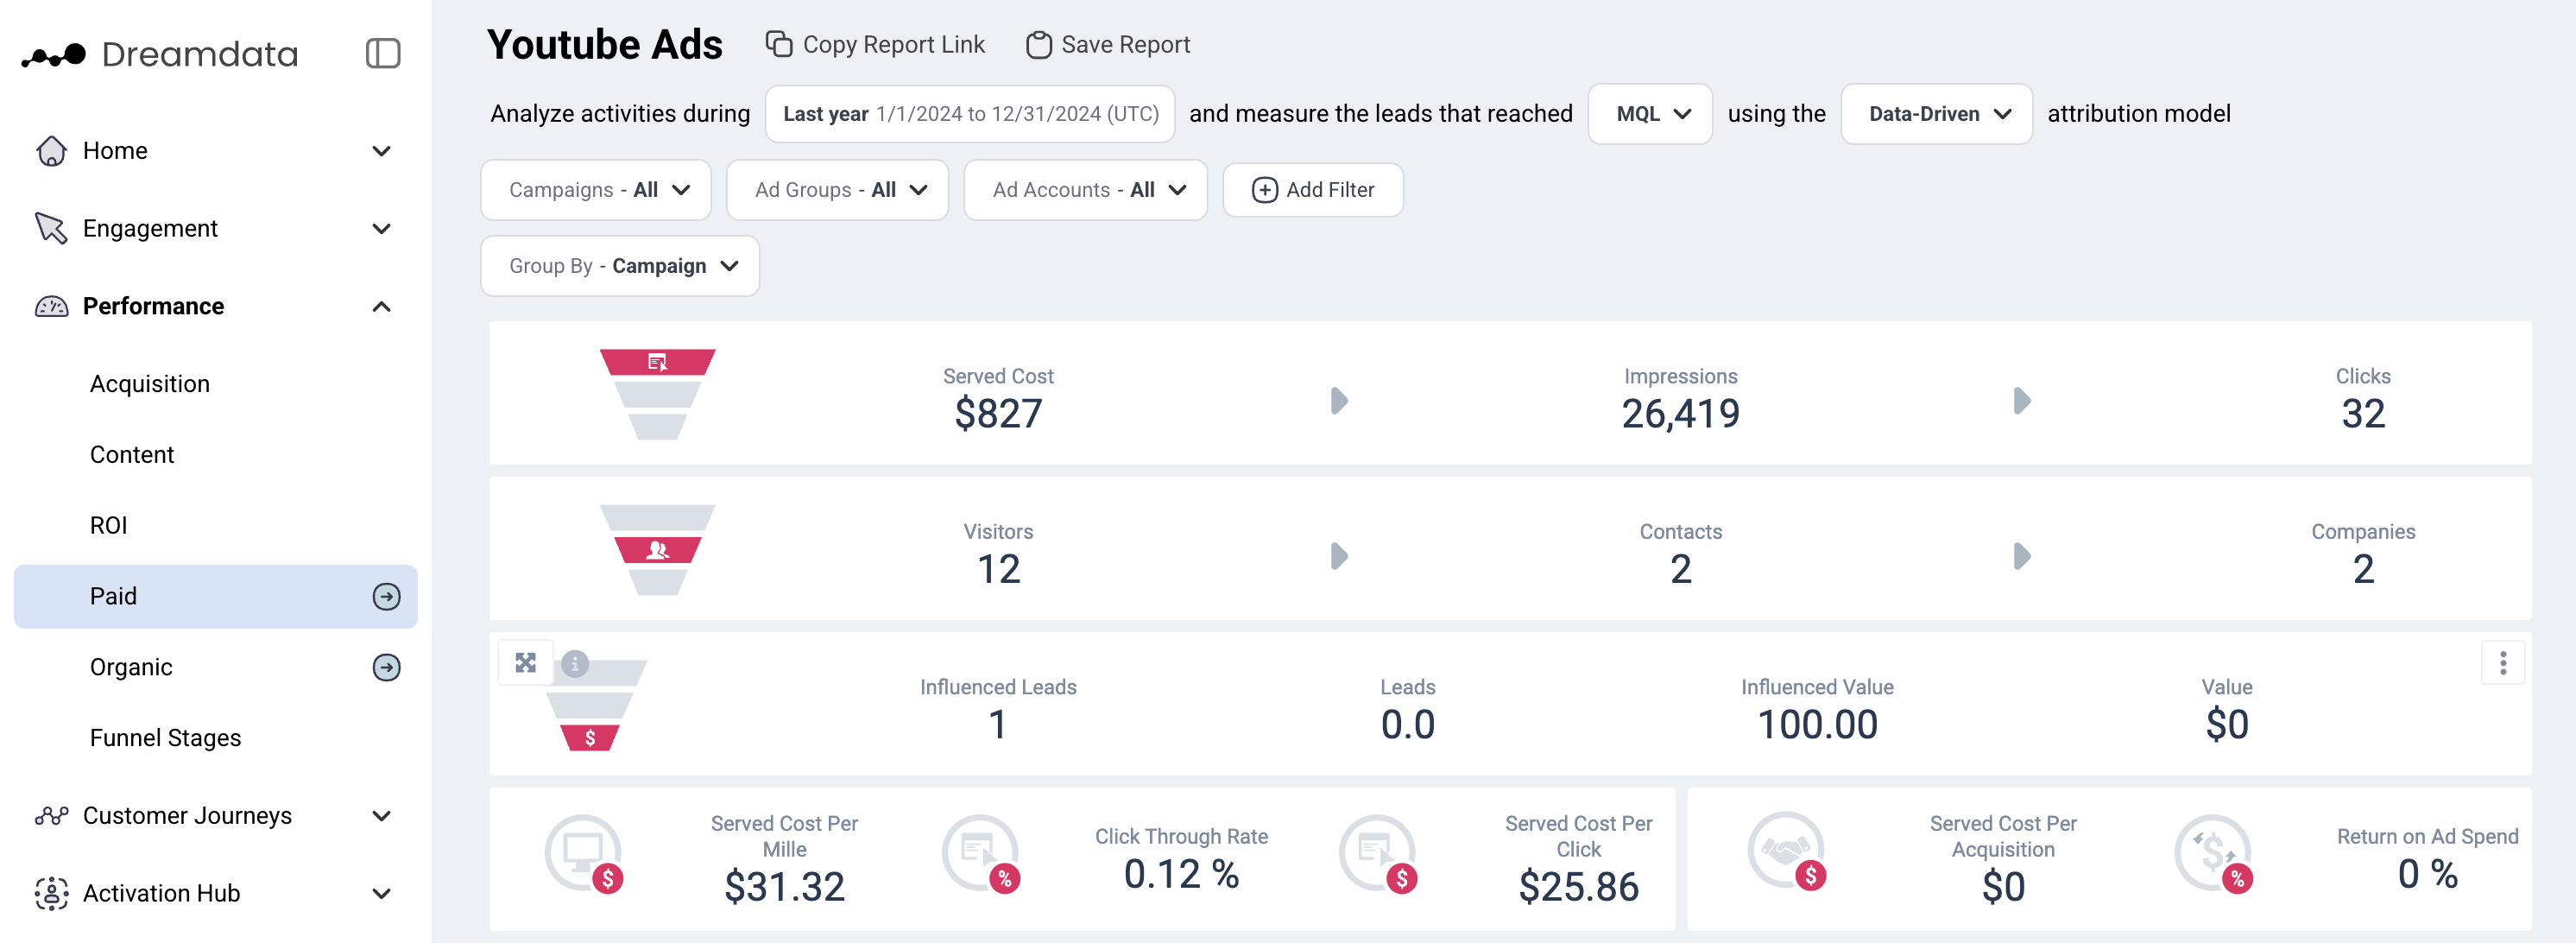
With this dashboard, we give users all the info they need to understand how their YouTube Ads are performing, particularly in regards to generating Revenue. From the overall funnel, down to campaign and audience level etc. You get the full perspective and can make data supported decisions and strategy.
Filters
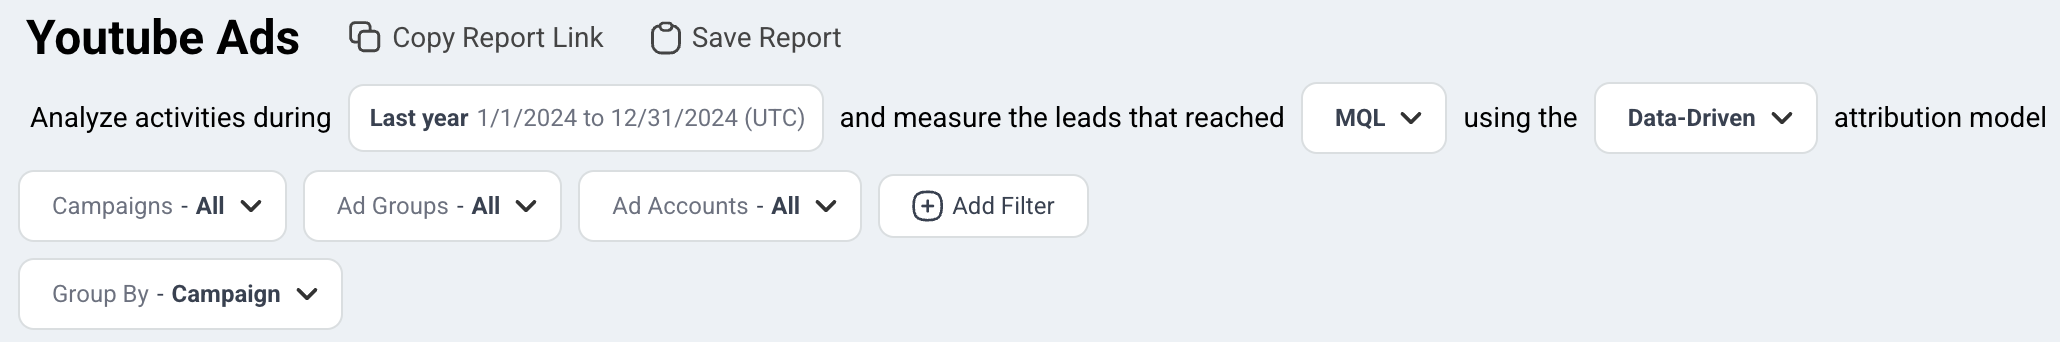
Date: Set the time period you want to investigate. Note that Date refers to the time period when visitors/contacts interacted with any YouTube Ads
Stage: You can select your preferred pipeline stage. Read more about the Free Tier Stages here
Attribution: Choose the attribution model which is meaningful for your analysis
- First Touch
- Last Touch
- Linear
- U-Shaped
- W-Shaped
Campaigns: Choose the campaign you want to investigate
Ad Groups: Choose the ad groups you want to analyse
Ad Accounts: Choose the ad account/s you are interested in
Group By: Choose your preferred option
- Campaign
- Ad Group
- Audience Demographics
- Bid Strategy
- Country
- Ad Account
Metrics
Served Cost: The served cost is the cost of all the clicks or impressions that the campaign received. Please note that there is difference between Served Cost and Billed Cost. Google Ads API currently does not expose Billed Cost metric.
Impressions: The number of times your ad was shown to a potential customer.
What counts as an impression today?
- The thumbnail or a video has to be shown for more than 1 second and at least 50% has to be visible to viewers, see image below.
- An impression is counted right away if a viewer clicks on the thumbnail. Clicking on a link does not count as an impression.
- Notifications and traffic from external websites or end screens are not included in your impression number.
Clicks: The amount of YouTube campaign clicks recorded by Google Ads
Visitors: The number of unique users who clicked your YouTube ads during the given time period
Contacts: The number of visitors who we have been able to attach an email to their user id
Companies: The number of companies who are attached to Contacts, or the number of companies in your CRM who we can be attached to any visitor traffic (anonymous)
Deals: The number of deals that are associated with YouTube campaigns based on your selected filter
Value: The amount of revenue than is attributed to the YouTube campaigns based on your selected filter
Cost per Mille (cpm): Cost per thousand, this calculation is used to denote the price over 1,000 impressions
Click Through Rate (ctr): Clicks/Impressions
Cost Per Click (cpc): Total Cost/Clicks
Cost Per Acquisition (cpa): Total Cost/ Attributable Deals
Return on Ad Spend (ROAS): Total Attributable Revenue/ Total Cost
Views: On YouTube a view is counted when someone watches 30 seconds of your video ad (or the duration if it's shorter than 30 seconds) or interacts with the ad, whichever comes first.
View Rate: The percentage of people who watched your ad when it was served to them (in other words, total views divided by total impressions). It’s a pretty good indicator of how well your creative is working, and if you’re targeting the right people.
Cost per View (cpv): This is how much you spend every time someone engages with your ad or views it for at least 30 seconds (or the entire duration if it's shorter than 30 seconds).
Video Played To 25%, 50%, 75%, 100%: How often people watch 25%, 50%, 75% or 100% of your video
Funnel Overview
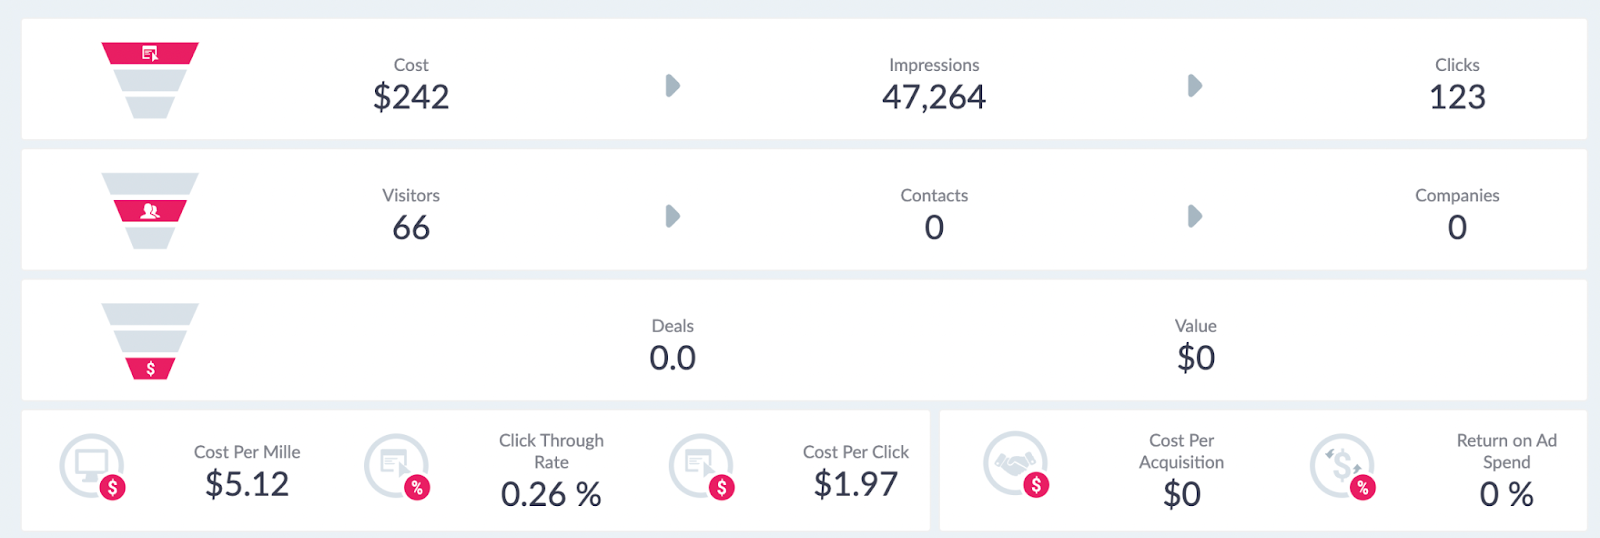
Cost → Impressions → Clicks
In this first section, we provide the top of the funnel for your YouTube Ads for the given time period. This data is pulled directly from Google Ads through our integrations.
Visitors → Contacts → Companies
In the next section, we give an overview of the traffic from YouTube Ads which is based on the Tracking script we have on your websites.
Value → Deals
In the third section, we provide the total number of Deals and Revenue that can be assigned to YouTube Ads based on the filters selected.
To calculate these numbers, we first look at the pool of contacts/companies that visited a YouTube campaign based on the dates/filters. Once we have that group, we see what deals were closed after their visit, up to today's date. More importantly, we are only looking at deals where we have a recorded history of sessions: Deals. This pool of deals will make up the basis for this section. For each of these deals and all their sessions, we will run the Attribution Model you have selected so each session is given a deal and revenue amount.
For both Deal and Revenue, we then provide the sum of these amounts for each session that contains a YouTube Ad, depending on which Attribution Model you have selected.
This explains why when using First Touch/Last Touch you will get a round Deal number, as a deal is either First Touch Paid or Not. While with Linear, W-Shaped or U-Shaped you will get a fraction of a deal as most Paid Touchpoints will make up a fraction of the sessions on a deal.
Cpm → Ctr → Cpa → ROAS
On the fourth row, we provide some common KPIs, most important Return on Ad Spend.
Graphs and tables
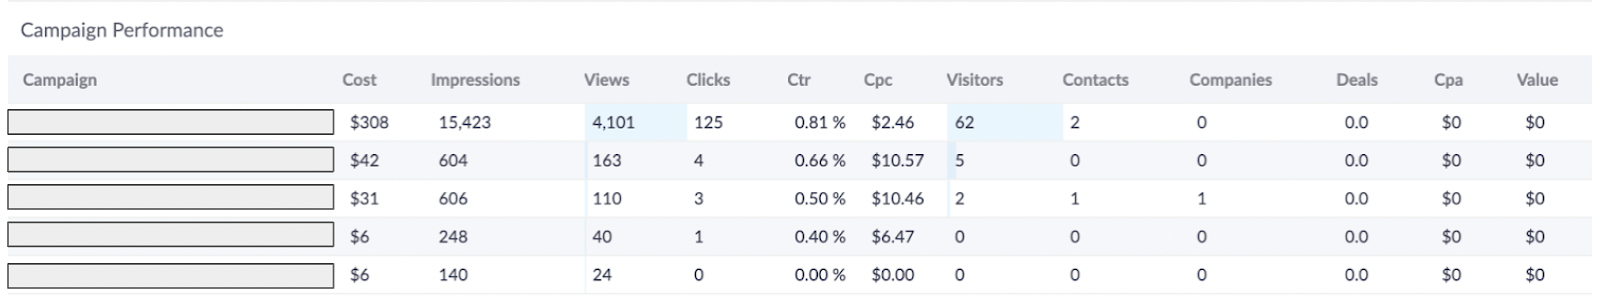
Campaign Performance
In this table, we list all the YouTube Campaigns and Ad Groups that were running during the time frame specified. We provide all the metrics for each campaign making it easier for you to compare and find out which performed and which ones did not perform. If you click on the Title Campaign Performance in the top left corner of the Table, it will open a larger view, which is better for navigation.
Audience Demographic Performance
This report shows which audience or demographic group most of your visitors are from.
Geo Performance
This report shows where your campaign click events happen, and which regions bring more value than others.
Bid Strategy Performance
This report can help you compare different bid strategies and help you make a decision on choosing bid strategy when you set up campaigns.
Average Video Completion Rate

This graph shows how often people watch 25%, 50%, 75% or 100% each of your videos. The video duration is appended to the video name on y axis. You will get a general idea of which ad seems to be more interesting to your audience.