Get started with Dreamdata
What is Dreamdata? [VIDEO]
Setting Up Dreamdata
How to set up Dreamdata Web tracking (analytics.js) manually
How to set up up Dreamdata web tracking (analytics.js) using Google Tag Manager
How to track forms adding the auto-identify script via Google Tag Manager.
The Onboarding Process
Onboarding process for free customers [VIDEO]
Onboarding for paying customers [VIDEO]
Single sign-on
How to invite your colleagues to Dreamdata
Dashboards
Home
Engagement
Performance
Content Performance
Analytics
Which channel performs best for different content?
Which content influenced the MQLs created in a time period?
Content Performance - Dashboard Options
Which content generates pipeline?
Measuring influenced pipeline for B2B content - the true conversion metric
What KPI to measure the effect of B2B content?
Setup Content Reporting
Content Analytics - Dashboard Options
Paid
Overview
Ad Spend
Return on Ads Spend
Google Search Ads
Google Display Ads
LinkedIn Ads
Bing Ads
Facebook Ads
YouTube Ads
Capterra Ads
G2 Crowd
Organic
Acquisition
Conversions
Web Traffic
Performance vs. Revenue attribution: A guide on when to use what
Journeys
Revenue Analytics
Data Platform
Sources
Intent Data
Paid
Setting up Facebook Ads
Setting up AdRoll
Setting up Twitter Ads
Setting up Bing Ads
Setting up LinkedIn Ads
Setting up Google Ads
Setting up G2
Setting up Capterra
CRM
Marketing Automation
Import Other
Import fixed cost data using Google Sheet
Importing data not in your CRM (using Google Sheets)
Import cost data using Google Sheet
Custom data
Setting up Outreach
Setting up Zapier integration & Zaps for Lead Ads
Setting up Google Search
Setting up Intercom
Destinations
Ad Network
Data Warehouse
Google BigQuery
Connect to AWS Redshift using AWS Glue
Connect your Dreamdata data to Snowflake
Connect your Dreamdata data to Amazon Redshift
Cloud Storage
Business Intelligence
Guides for Looker Studio Reporting
Getting Started with Looker Studio Templates
Google Connected Sheets
Setting up Data Export to BigQuery of CRM Properties
Overview
Company Data Enrichment
Table Schema
Intent data
General Settings
Tracking
Segment
Dreamdata Cookies
Form Tracking
Reduce impact from ad-blockers and Apple ITP 2.x
Pardot iframe form tracking
Anonymizing IP
Tracking using Sleeknote or Drift
How to track your emails?
Cookie Bar
How does Dreamdata track all relevant on-site customer data?
Cookie Retention
Tracking Hubspot Forms with auto-identify script
Server Side Analytics APIs
URL query parameters
Calendly
Tracking iframes with auto-identify script
Tracking SPAs (Single Page Applications)
Across domain & device tracking
Advanced Identification of users and companies
Stage Models
Setup Guide: All Salesforce Opportunities entering specific Stage
Setup Guide: Creation of Opportunities/Deals
Setup Guide: Tracked sign-up events
Setup Guide: All Hubspot Deals entering specific Stage
Stage Models - Customization
Menu: Settings
Allowed Domains
UTM Mapping
Branded Search filter
CRM-Based Channel and Source in the Absence of Tracking Activity
CRM filters
FAQ
Glossary
Categories
Some of my deals are flagged with "Unknown". What does it mean?
Data retention
Can I exclude content or websites from being tracked?
How are activity mapped to companies?
What does Visitors, Contacts and Companies mean?
What is a session?
Roles and Permissions
What is the reporting Time Zone?
Why are my dashboards empty?
Agency Partners
Welcome Partner!
Partner Tiers
Referral Guide and UTM tracking
Partner Material
Intro Template for your new clients
Ideal Customer Profile
Co-marketing and account mapping
Contact
Quick learning videos!
Find the content that generates most pipeline
How to set up content categories on Dreamdata
Do you know how your company is generating money?
How to see the value of B2B Google Ads in pipeline and revenue generated
How Content Analytics tracks the influence of content of pipeline and revenue
How to easily build a retargeting audience with Dreamdata
Are you using G2?
Performance vs. Revenue Analytics reports- when to apply them best!
What attribution really is and why you should care!
Helping BDRs break through to the hottest accounts
Dreamdata Content Analytics: Discover the real value of your content
Do you know which of your Marketing activities had the biggest impact on pipeline and revenue?
Which of your emails produce pipeline and revenue?
See the value of SEO in pipeline and revenue generated
How to cut the cost of your Google Search Ads
- All Categories
- Dashboards
- Performance
- Content Performance
- Analytics
- Which content influenced the MQLs created in a time period?
Which content influenced the MQLs created in a time period?
Updated
by Mikkel Settnes
How to use Dreamdata to measure which content affected the MQLs created in a selected time period
In Dreamdata, the pipeline stages are defined using the Stage option.
First step is to choose which stage to analyse. Below we use Marketing Qualified Lead (MQL) as an example.
To analyze which content the influenced MQLs generated in a selected time period, we set the dashboard options as shown.

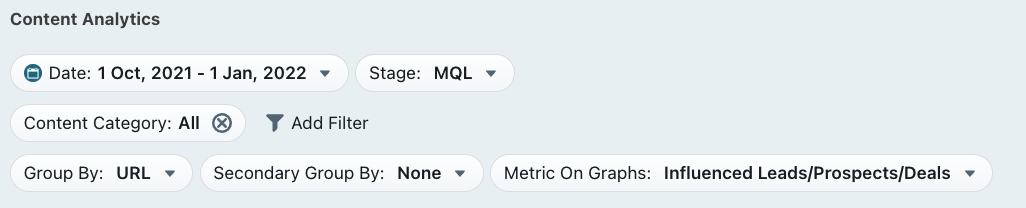
This will setup the report to investigate:
- Which content influenced the MQL's generated between 1 Oct 2021 - 1 Jan 2022?
To consider what pipeline was generated by content views in a certain time period, go to Content Performance.
The Group By option indicates the granularity of the content we want to show. if we are tracking a substantial amount of individual url’s, it might provide a clearer view to aggregate them by content category. Note that content categories need to be setup within the Dreamdata application (see here)
Here we leave The Secondary Group By to None as we do not want to further split the URL in this analysis.
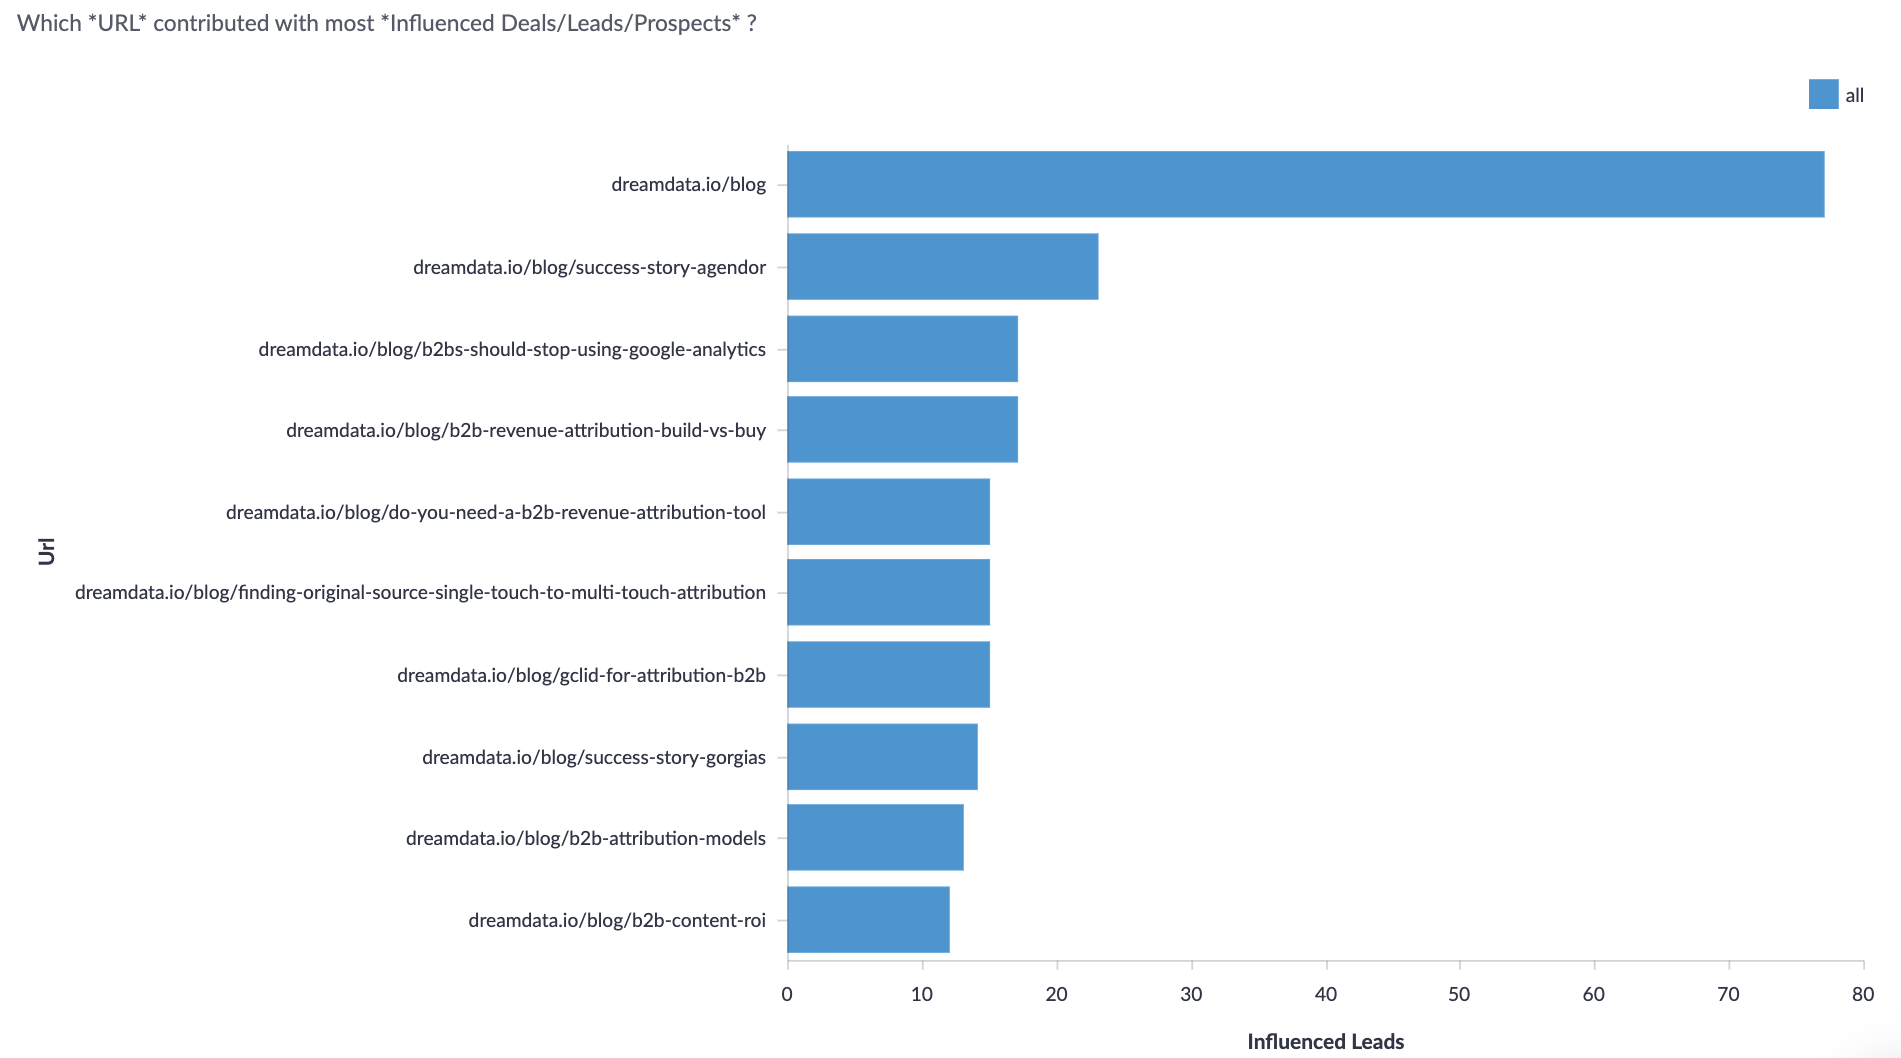
The top part of the dashboard shows the total number of selected Leads on the left and on the right it shows the number of those Leads that was influenced by some content.

The graph shows the top 10 urls that influenced the most of the total selected MQLs.
This can be used to quickly identify the content that influenced the most MQLs generated in the selected period.

The summary table shows detailed information for each url or category. Note that no secondary group by is selected in this analysis, so it is showing all (= no split groups).
The first table shows the number of contacts from the MQLs that read each content piece.
The table is ordered by the number of Influenced Leads (and the percentage of selected Leads influenced), shows which content affected the most of the MQLs thereby identifying the content that was consumed by readers that became MQL in the selected time period.

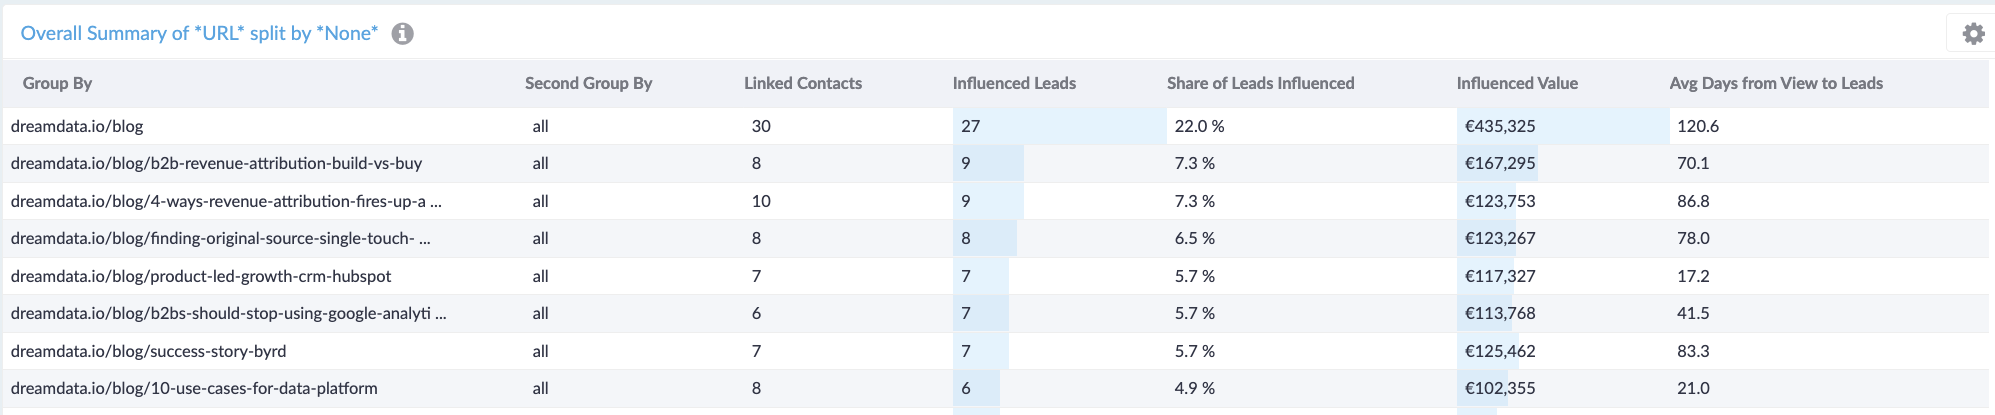
Lastly, the table shows the average number of days between the content was viewed and when the lead was generated. A high number of days indicate that on average there is a long time between MQL readers view the page and when they became an MQL. On the other hand, a low number of days indicate that for readers becoming an MQL does so short time after reading the content.