Organic
 Updated
by
Anton Lauritsen
Updated
by
Anton Lauritsen
With this dashboard, we provide an overview of the volume and performance of visitors that come through your social media channels.
This analysis shows how your website visitors, specifically those who came via social media, moved through the different stages of your pipeline. Graphs and tables will allow you to investigate and compare each channel performance.
Remember to adjust stages (sign up, opportunity created, opportunity won) based on the intention of your analysis
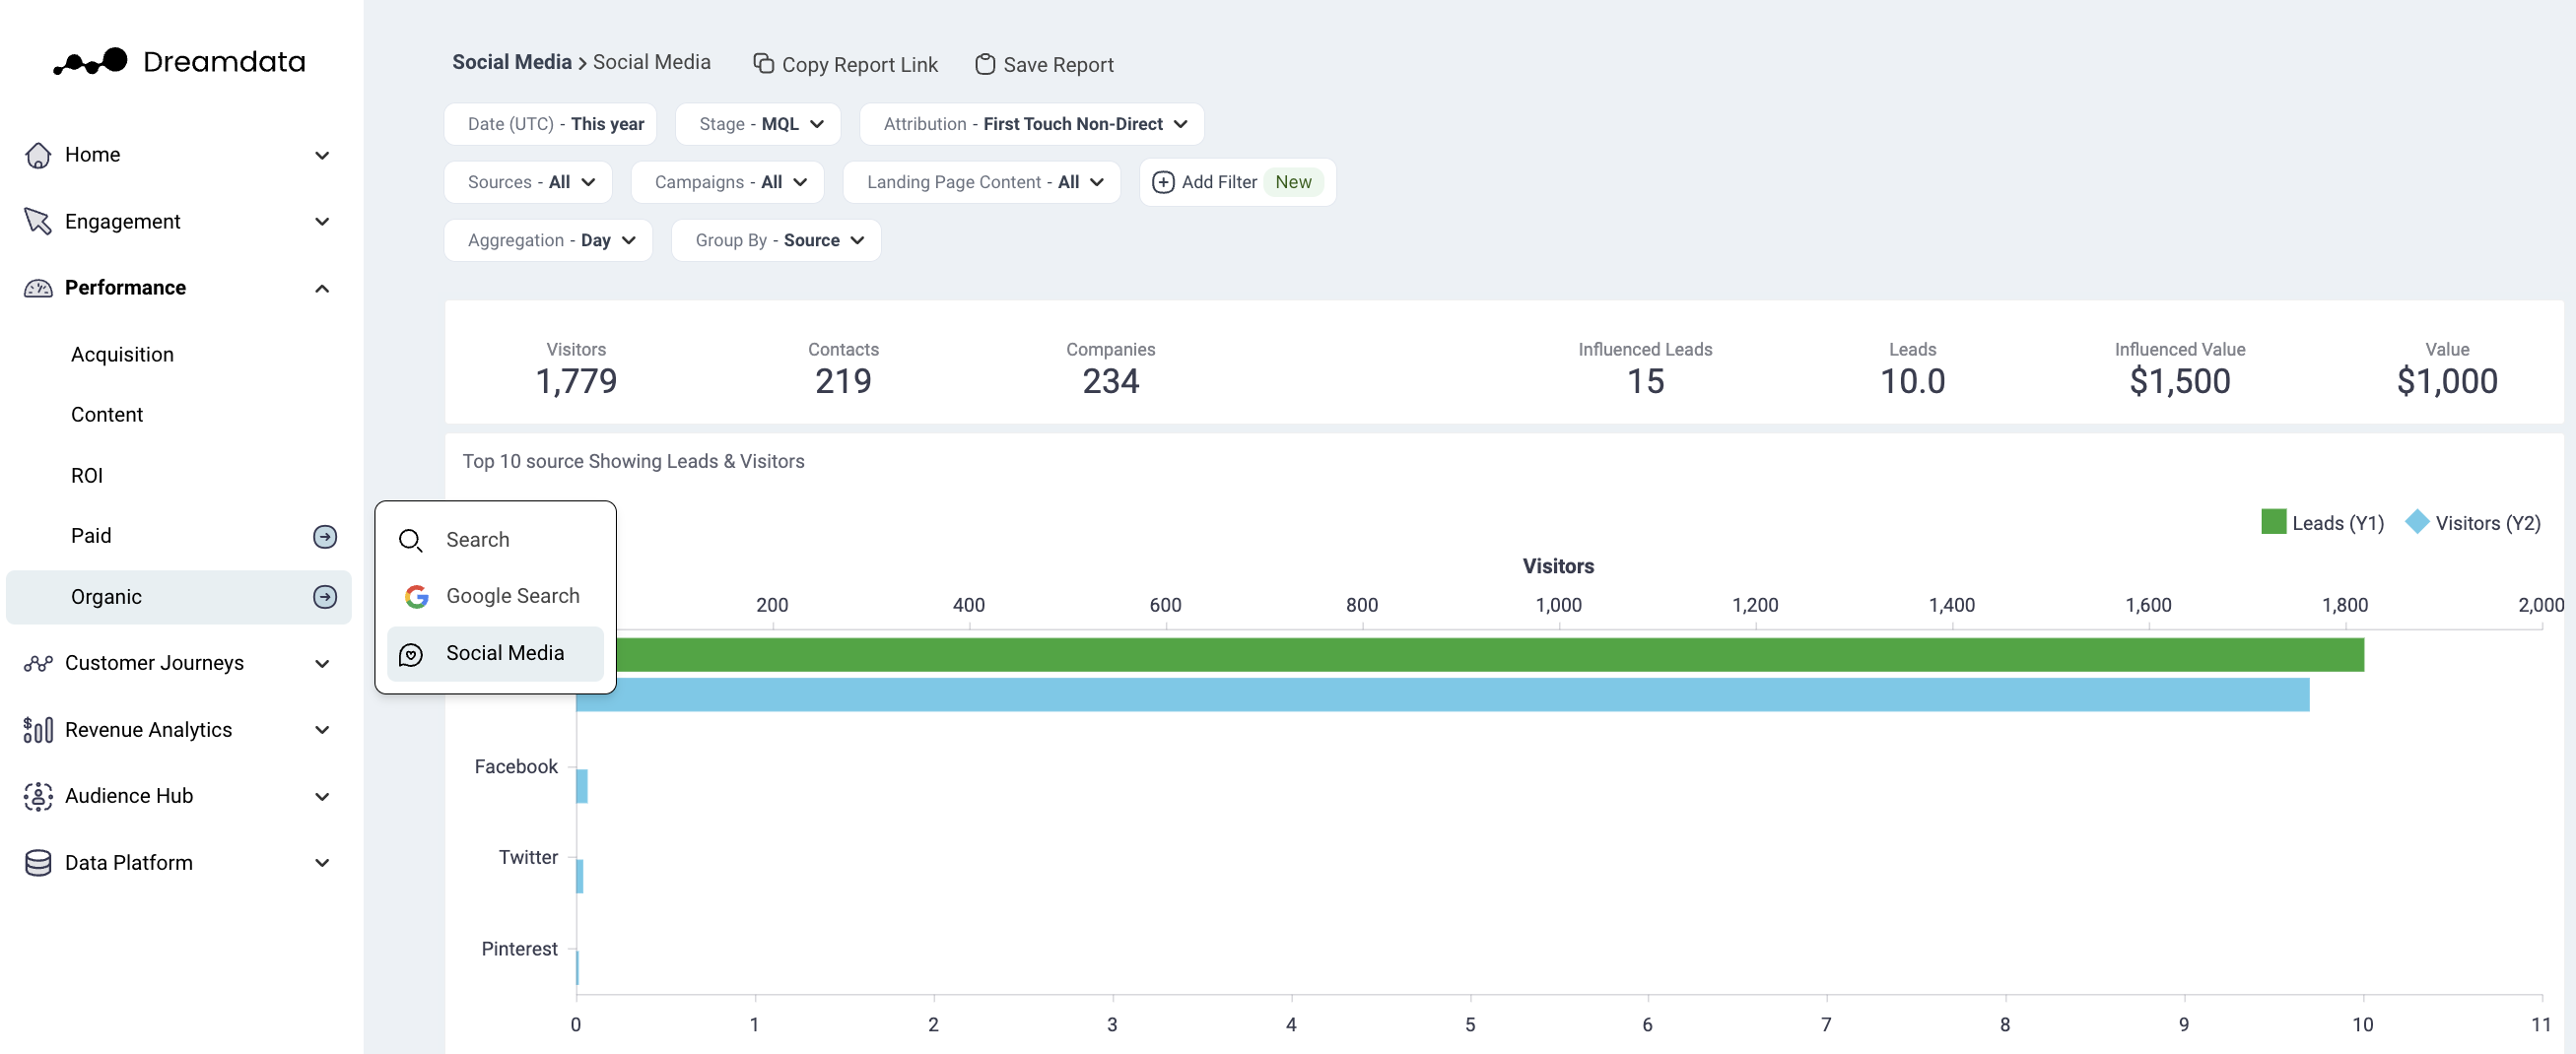
Filters
Date: Set the time period you want to investigate
Stage: You can select your preferred pipeline stage. Read more about the Free Tier Stages here
Attribution: Choose the attribution model
- First Touch
- Last Touch
- Linear
- U-Shaped
- W-Shaped
Sources: Choose the channel you want to focus on
- Facebook Messenger
- Youtube
Devices: Choose the device to analyse specific traffic
Content Groups: Choose the content group you want to analyse
- Pages
- Desktop
- Mobile
- Tablet
Group By: Choose certain options to see how it affects your deals
- Social Media
- Campaign
- Social Media + Campaign
- Page
- Device
- Content
- Country
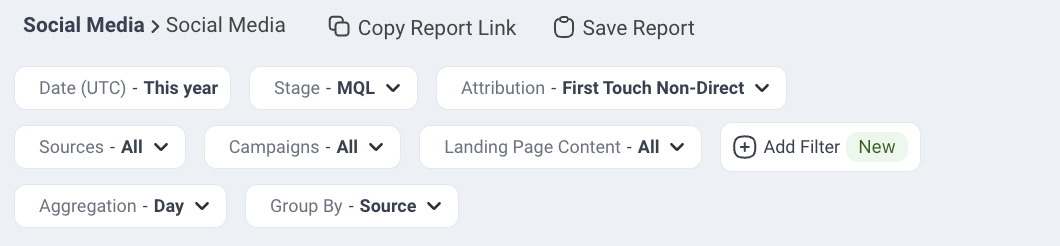
Metrics
Visitors: The number of visitors who have come to your website via Social Media
Contacts: The number of visitors who we have been able to attach an email to their user id
Companies: The number of companies who are attached to Contacts, or the number of companies in your CRM who can be attached to any visitor traffic (anonymous)
Deals: The number of deals that are associated with Social Media based on your selected filters
Value: The amount of revenue than is attributed to the Social Media based on your selected filters
Funnel Overview

Visitors → Contacts → Companies
In this first section, we give an overview of the organic traffic from different Social Media which is based on the Tracking script we have on your websites.
Deals with Organic → Value with Organic
In the second section, we provide the total number of Attributable Deals and Attributable Value (revenue) that can be assigned to different Social Media Engines based on the filters selected.
To calculate these numbers, we first look at the pool of contacts/companies that visited your website through different Social Media based on the dates/filters. Once we have that group, we see what deals were closed after their visit, up to today's date. More importantly, we are only looking at deals where we have a recorded history of sessions; Attributable Deals. This pool of attributable deals will make up the basis for this section. For each of these deals and all their sessions, we will run the Attribution Model you have selected so each session is given a deal and revenue amount.
For both Attributable Deal and Value (revenue), we then provide the sum of these amounts for each session that contains Social Media, depending on which Attribution Model you have selected.
Graphs and Tables
Deals and unique Visitors Split by Social Media
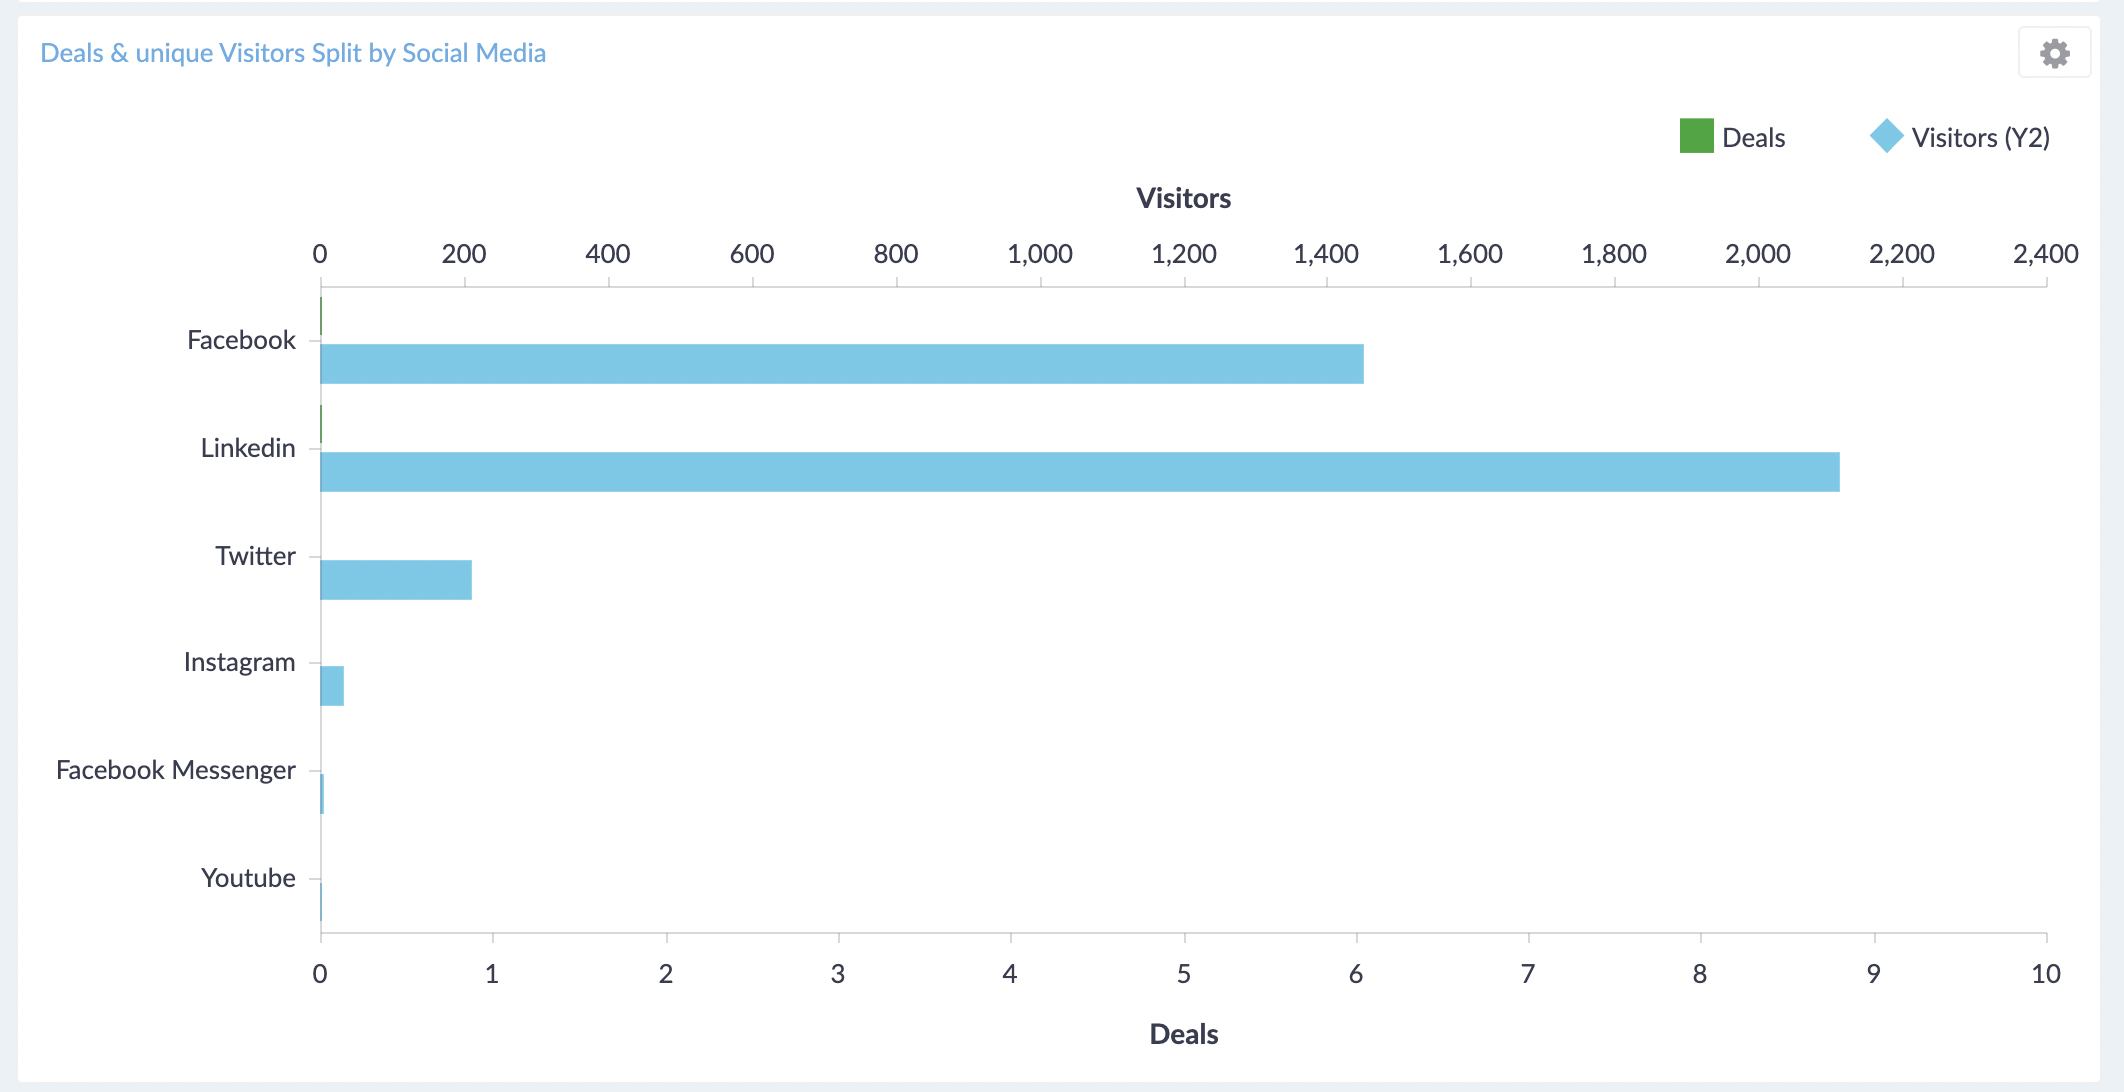
We provide a graph showing the organic traffic and attributable deals of each Social Media over the period of time specified in your Filters. This information can help you understand which Social Media convert better.
Performance by Social Media
In this table we provide the metrics of Social Media traffic, making it easier for you to compare and find out which Channel performed and which ones did not perform.
Performance by Page
This report shows which website pages have been used by Social Media Visitors, and which pages bring more value than others.
Performance by Content
This report shows which contents (videos, blog, website, etc.) have been used by Social Media Visitors, and which contents bring more value than others.
Performance by Campaign
This report shows which campaigns influenced Social Media Visitors to land on your website, and which campaigns bring more value than others.
Performance by Device
This report shows which devices have been used by Social Media Visitors, and which Devices bring more value than others.
Performance by Country
This report shows where your campaign click events happen, and which regions bring more value than others.
Deals Split by Sources over Time
This graph shows visitors who ended up being a deal. These accounts have come to your website through Social Media. Hover over the boxes above the graph to display individual Channels.
Visitors Split by Sources over Time
In this graph we display visitors that have come to your website through Social Media. Hover over boxes above the graph to display individual channels.