Acquisition
The Acquisition report helps you understand how your marketing activities are influencing pipeline and funnel progression by showing leads, prospects and deals (sign up, opportunity created, opportunity won). It first looks at the timestamp of events within a selected date range, then checks whether the account or contact associated with that event reaches a defined stage model (e.g., MQL, opportunity created, closed won) after that event occurred. The order is important: the event must come before the stage model milestone. Companies with no events before a stage will not be shown in the acqusition report.
Filters
You can compare and analyse based on multiple filters such as Channels, Sources, Campaigns, etc.
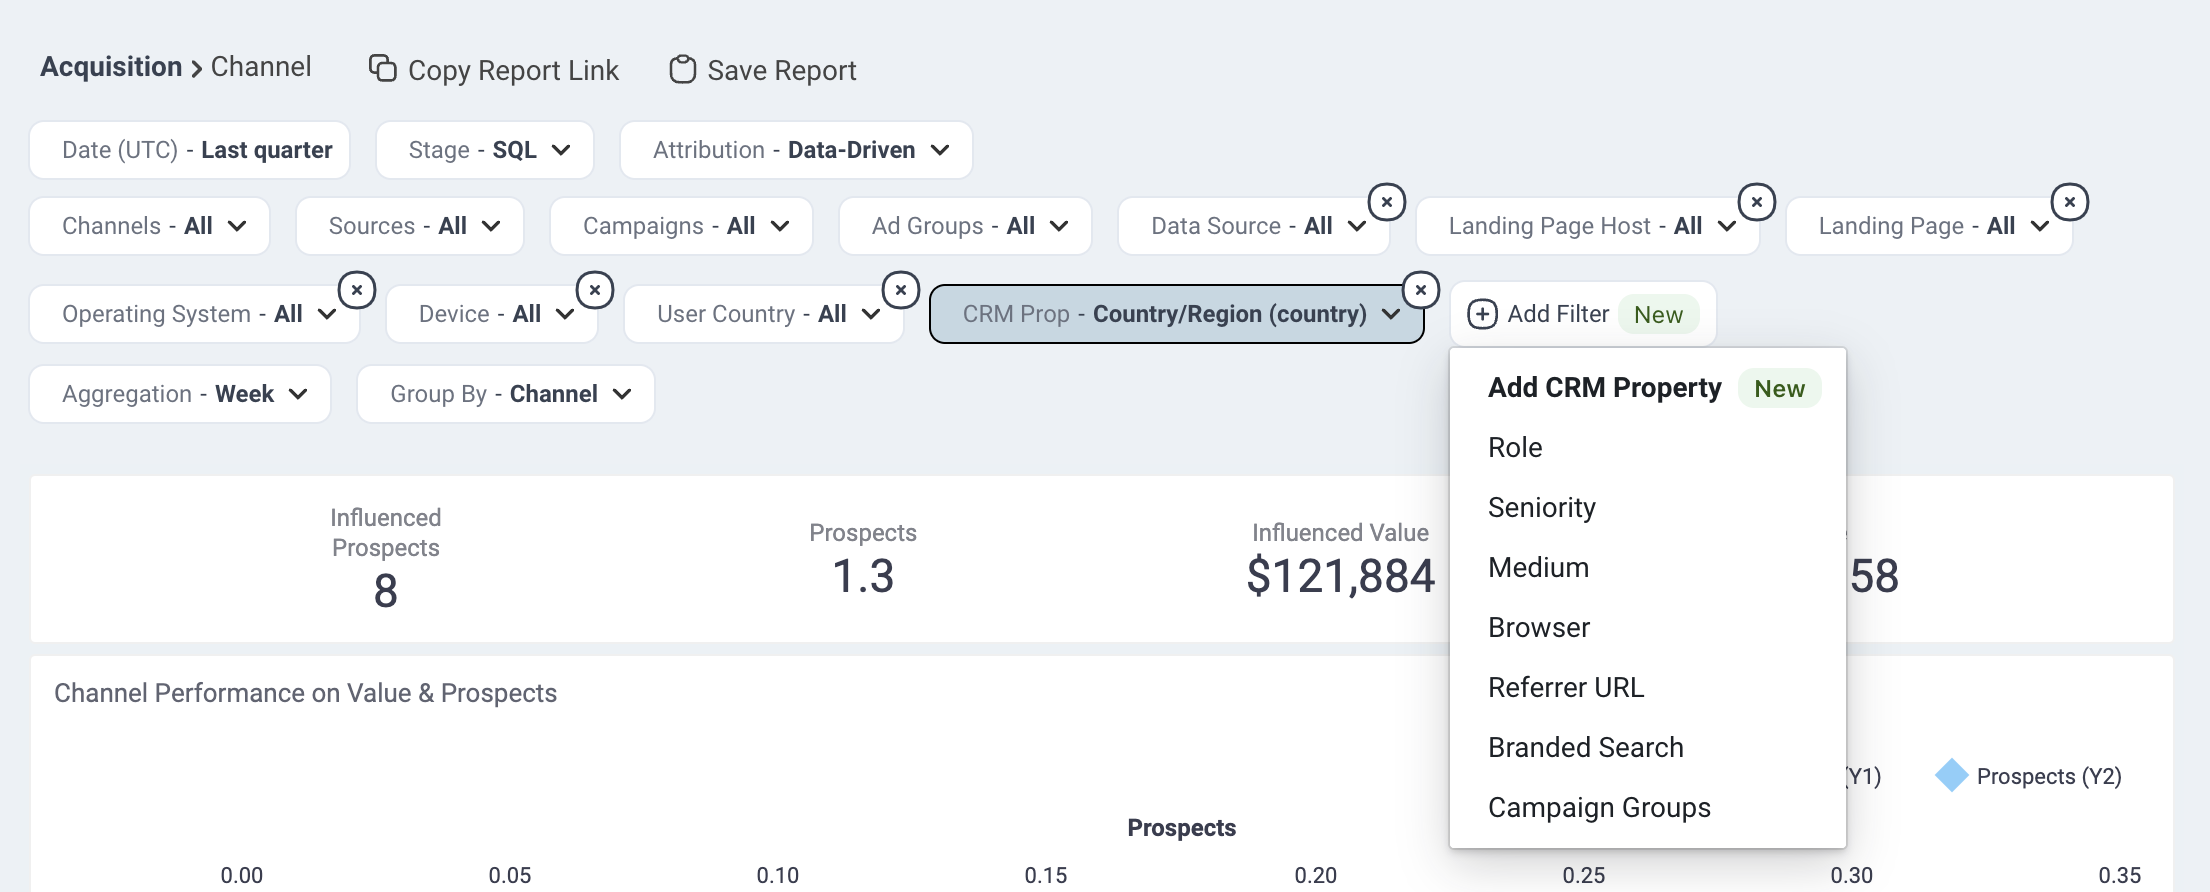
Date: Referring to the time period when the deals were completed
Stage: You can select your preferred pipeline stage. Read more about the Free Tier Stages here
Attribution: Choose the attribution model which is meaningful for your analysis
- First Touch
- Last Touch
- Linear
- U-Shaped
- W-Shaped
- Data-driven
Aggregation: Set the time frame you wish your data to be displayed
Grouped by: Select certain options to granularly analyse how a channel is performing given your group by sorting
CRM Property filter: Filter directly on properties from your CRM
Devices: Choose the device to analyse specific traffic (desktop, mobile or tablet)
Metrics
Deals: The number of deals who we have been able to identify as your chosen stage
Value: The amount of revenue that is based on your chosen stage. It can represent basic value estimation of sign up, expected revenue of deal created or actual revenue of deal won, taken from your CRM
Funnel Overview

This row shows the last section of your funnel. We provide the total number of Influenced and Attributable Deals, as well as, Influenced and Attributable Value (revenue) that can be assigned, based on the filters selected.
How are these calculated?
To calculate these numbers, we first look at the pool of contacts/companies that visited your website based on the dates/filters. Once we have that group, we see what deals were closed after their visit, up to today's date. More importantly, we are only looking at deals where we have a recorded history of sessions and Attributable Deals. This pool of attributable deals will make up the basis for this section. For each of these deals and all their sessions, we will run the Attribution Model that you have selected so each session is weighed accordingly.
For both Attributable Deal and Value (revenue), we then provide the sum of these amounts for each session that contains conversion, dependent on which Attribution Model you have selected.
Note: When using First Touch/Last Touch you will get a round Deal number, as a deal is either First Touch Paid or Not. While with Linear, W-Shaped or U-Shaped you will get a fraction of a deal as most Paid Touchpoints will make up a fraction of the sessions on a deal.
Graphs and Tables
Channel Performance on Value and Deals
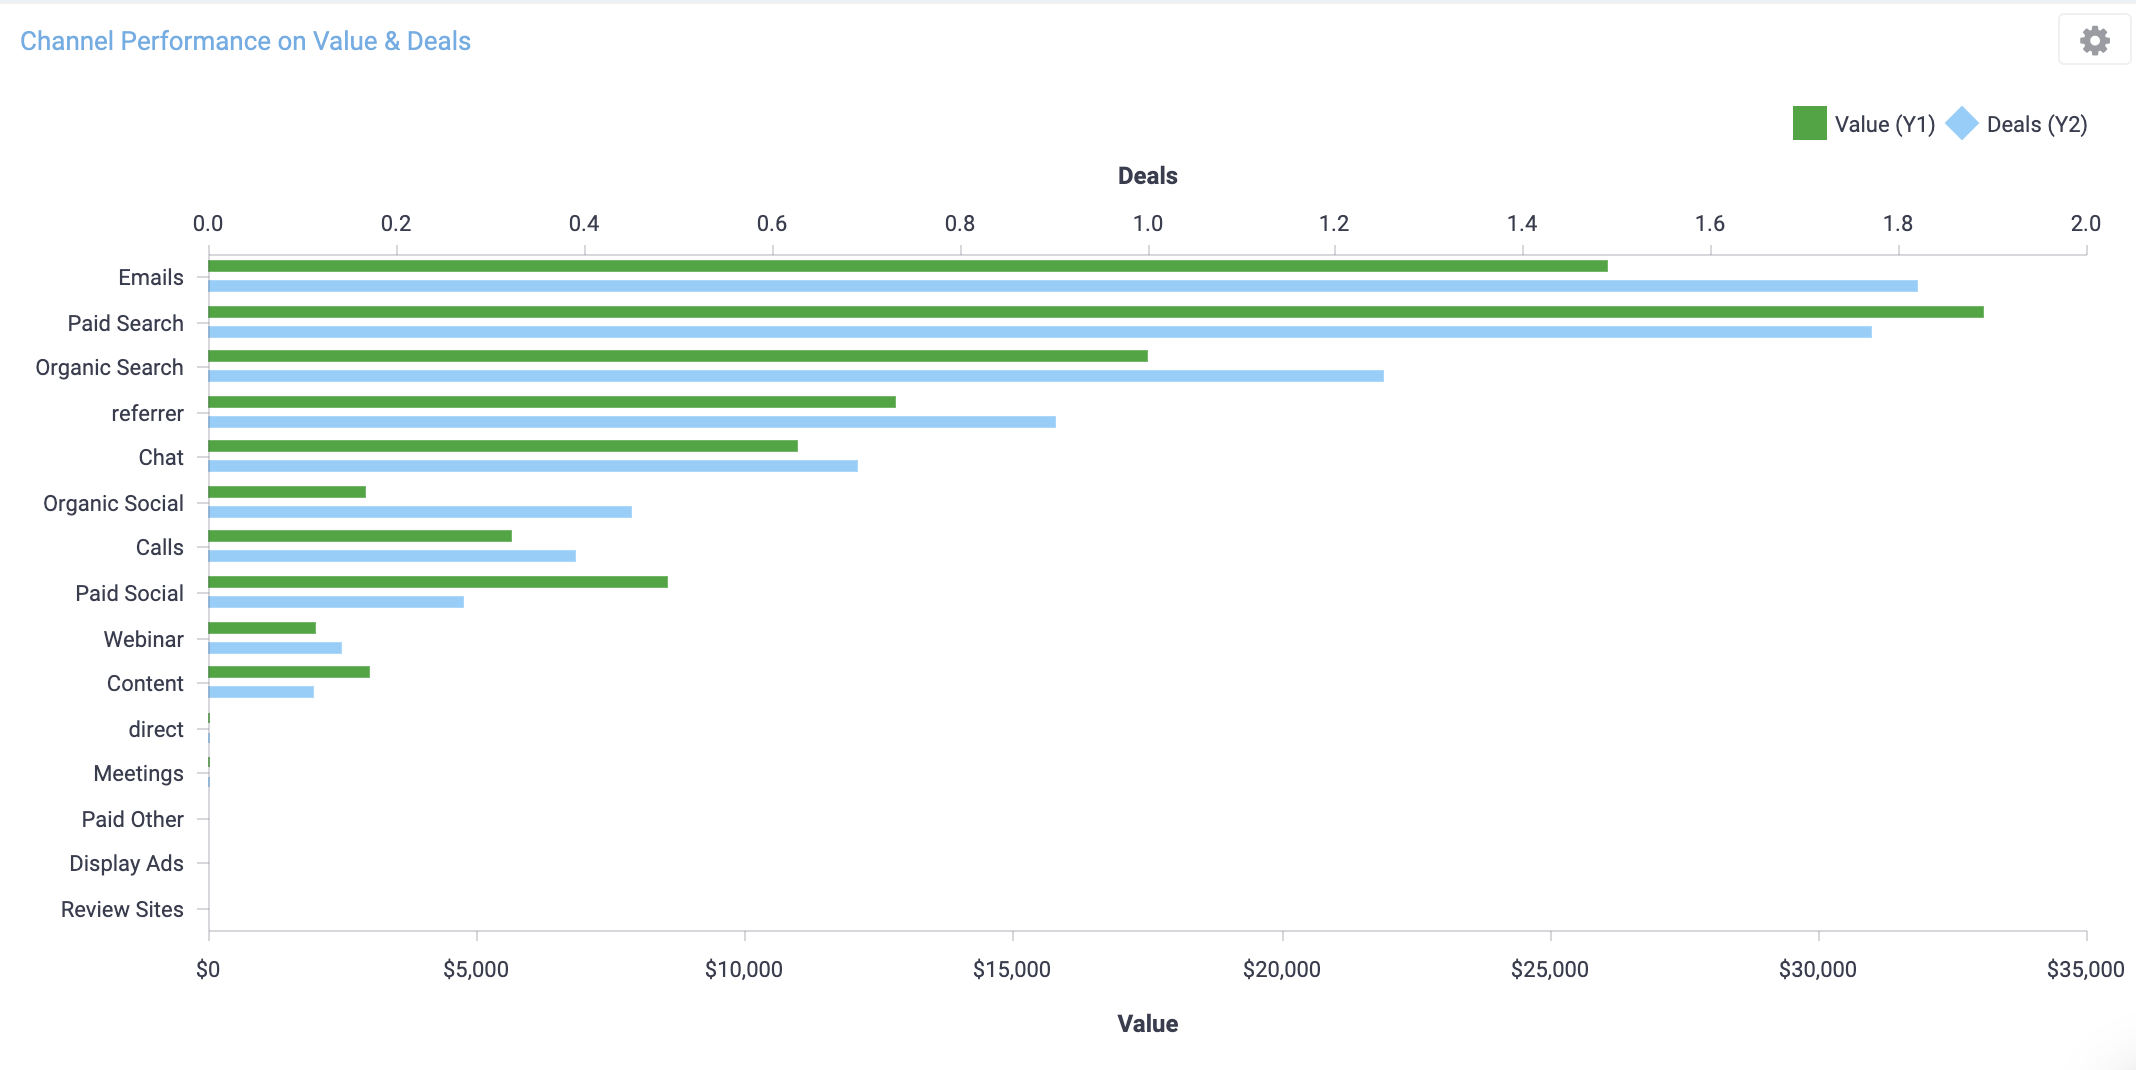
We provide a graph showing multiple channel performance, based on your website visitors. This information is displayed by Deals and Value, which helps understand browsers' contribution to your business outcomes.
Note: This Graph is used for a quick overview of Visitors over Deals generated via different Browsers (split by your chosen Group By filter). Change filter to display: URL, Referral, Channel, etc.
Channel Performance
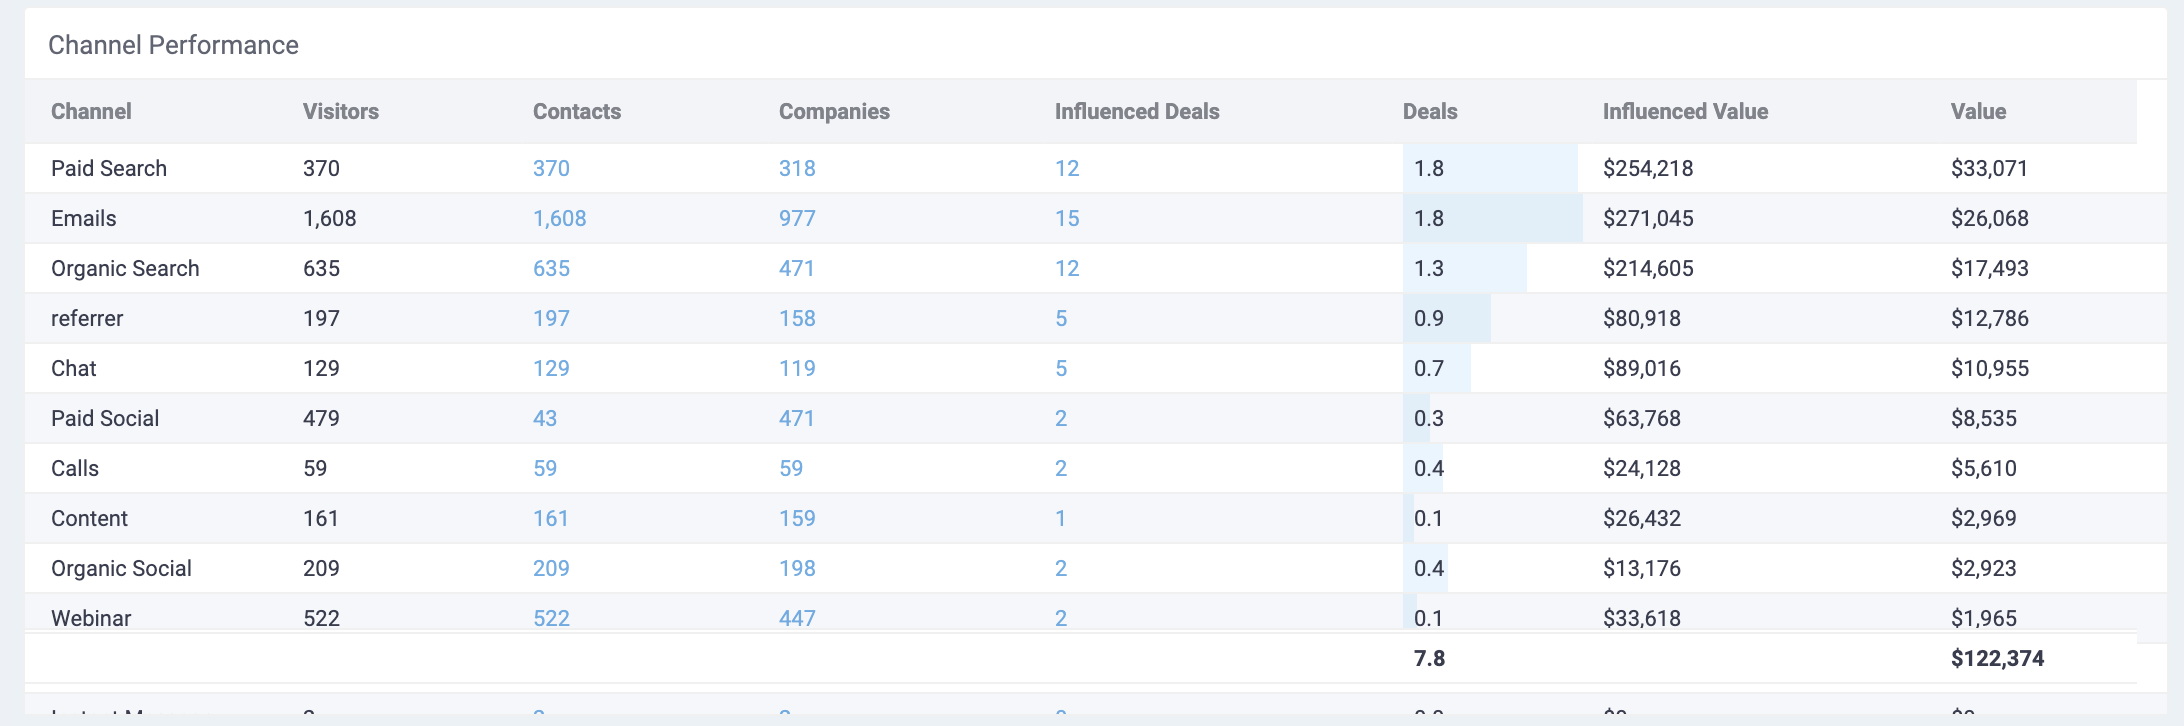
In this table, we list all the channels that were used during the time frame specified. We provide all the metrics for Channels making it easier for you to compare and find out which performed and which ones did not perform.
Channel Performance
This report shows which Channels have been used by your Visitors, and which Channels bring more value than others.
Source Performance
This report shows which Sources (Ad Networks) have been used by your Visitors, and which Sources bring more value than others.
Campaign Performance
This report shows which Ad Campaigns have been used by your Visitors, and which Campaigns bring more value than others.
Url Performance
This report shows which Urls have been used by your Visitors, and which Urls bring more value than others.
Referrer Performance
This report shows which Referrers have been used by your Visitors, and which Referrers bring more value than others.
Host Performance
This report shows which Hosts have been used by your Visitors, and which Hosts bring more value than others.
Device Performance
This report shows which Devices have been used by your Visitors, and which Devices bring more value than others.
Country Performance
This report shows where your campaign click events happen, and which regions bring more value than others.
Operating System Performance
This report shows which Operating Systems have been used by your Visitors, and which Operating Systems bring more value than others.
Ad Group Performance
This report shows which Ad Groups have been used by your Visitors, and which Ad Groups bring more value than others.
Note: You can open a larger view by clicking on the performance title in the top left corner.
Channel Performance by Leads (Over Time)
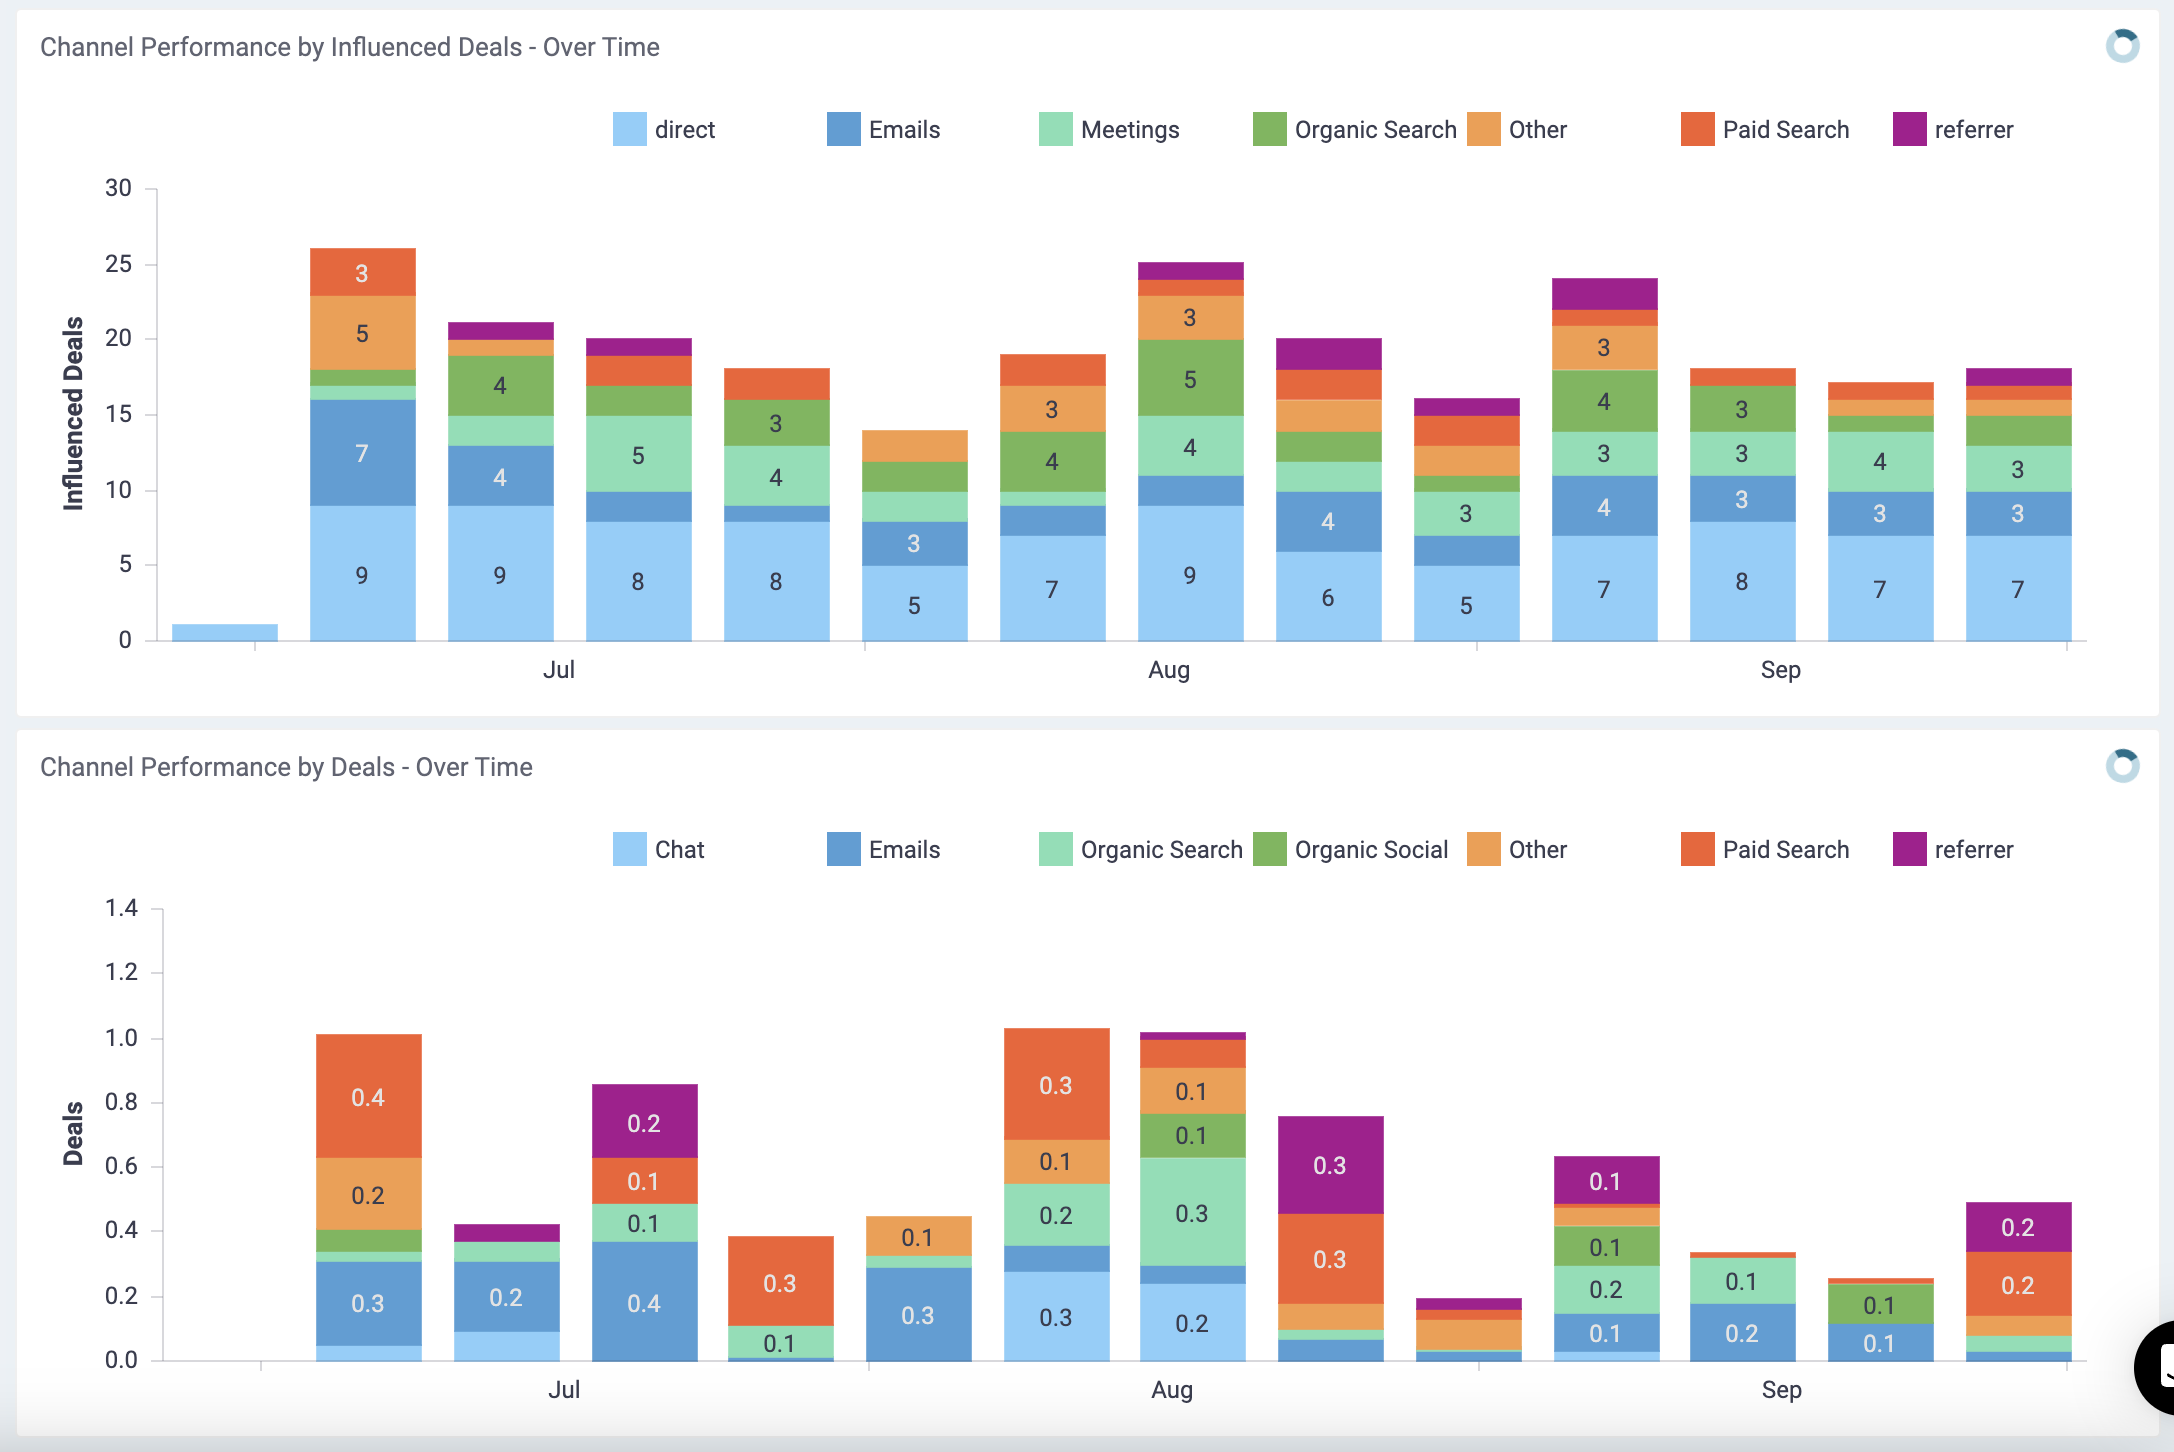
This graph will allow you to see which channel brought you the most Deals over a specific Time period.
Note: This Graph is used for a quick overview of Deals/Leads/Prospects generated via different Channels/Browsers/Sources/URLs etc. (split by your chosen Group By filter).