Configurator
 Updated
by
Aleksandar Grbic
Updated
by
Aleksandar Grbic
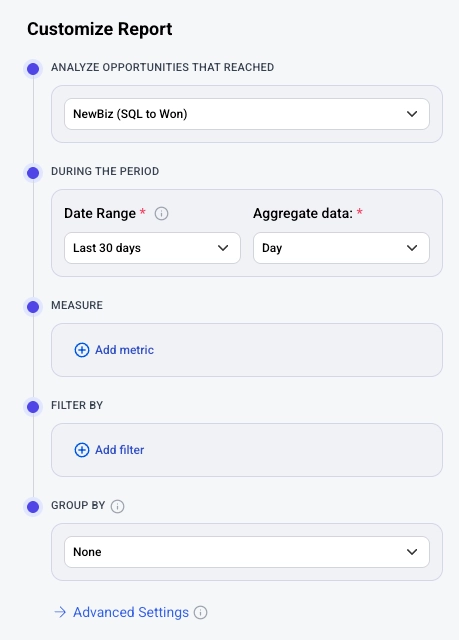
The configurator is the panel on the left side of the report screen where you define what your report analyzes. It is labeled "Customize Report" and contains all the settings that control which data appears in your report.
How the Configurator Works
The configurator's available fields depend on several factors:
- Report type — The report type determines which fields appear. For example, stage-based report types (Single-Stage Reporting and Analyze Stage Attribution) include a "Stage Model" selector that other types don't have.
- Template — If you created the report from a template the configurator is pre-populated with that template's settings. You can modify any of these values.
- Your account data — Metrics, filter dimensions, filter values, and group by options are dynamically loaded based on the data in your Dreamdata account. This means the options you see are specific to your connected integrations, stage models, and tracked activities.
Configurator Fields
The configurator is organized into sections, displayed top-to-bottom. Not all sections appear for every report type.
Stage Model (Stage-Based Report Types Only)
For the Single-Stage Reporting and Analyze Stage Attribution report types, the configurator begins with an "Analyze Opportunities That Reached" dropdown. You must select a stage model (e.g., “SQL”, “MQL”, "NewBiz (SQL to Won)") before configuring the rest of the report.
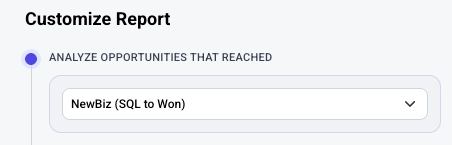
This field does not appear for the Analyze Engagement, Analyze Performance, Paid Performance, or Spend Summary report types.
During the Period
This section contains two required fields:
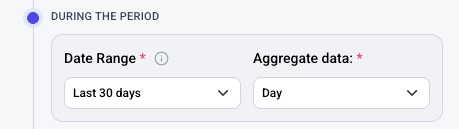
- Date Range — The time period to report on (e.g., "Last 90 days," "Last 30 days," or a custom range). This is required.
- In stage reports the date range selects either the time when a company reached a specific stage.
- In spend, performance and engagement reports defines the spend or activity cohort you are looking at.
- Aggregate data — How data is grouped over time (e.g., Day, Week, Month, Quarter). Required. This controls the x-axis intervals in time-series widgets. For example, selecting "Month" groups data into monthly intervals.
Metrics
This section allows lets you select the metrics you want to analyze.
- For most report types, this section is labeled "Analyze and Measure."
- For stage-based report types, it is labeled "Measure."
- Click Add metric to choose what you’d like to analyze. A menu will appear to help you find relevant metrics. You can find the metrics you’re looking for by either:
- Clicking on one of the pills at the top of the menu to narrow down the metric type
- Using the search bar
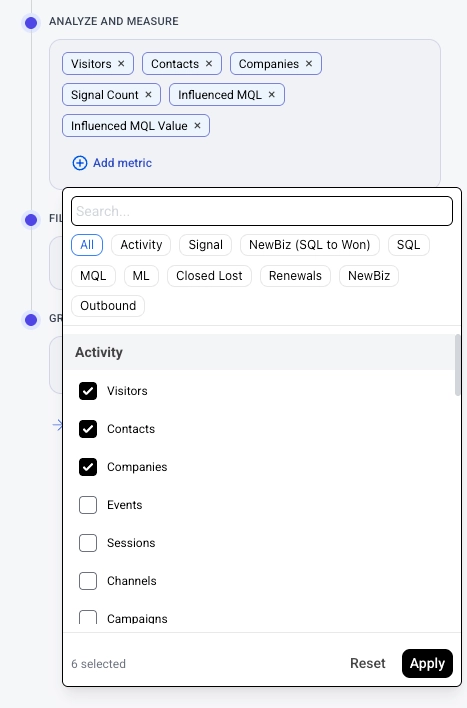
The available metrics depend on your report type and account data.
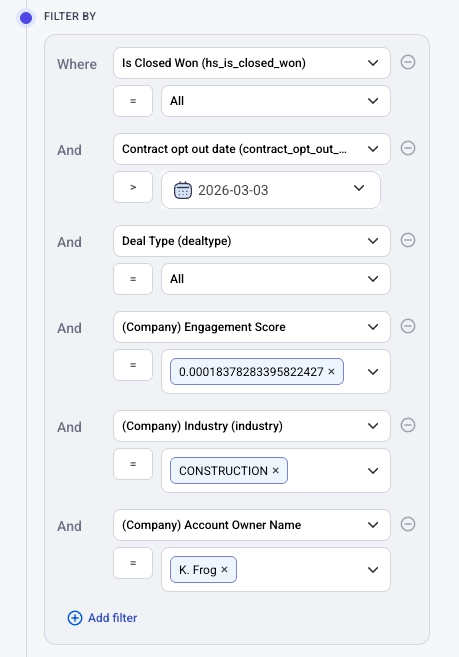
Filter By
Narrow your data to specific subsets using filters.
- Click Add filter to create a filter condition.
- Each filter has three parts: a dimension (e.g., "Cost Channel"), an operator (e.g., "="), and one or more values (e.g., "Paid Search"). The available operators depend on the type of dimension.
- Boolean (i.e. true / false): Equals any of
- Date: After / Before
- String: Equals any of, Does not equal any of, Contains, Does not contain
- Number: =
- You can add multiple filters. Multiple filters are combined with "And" logic — all conditions must be true for data to be included.
- Click the remove button (−) next to a filter to delete it.
Certain metrics called “Stage Metrics” are presented under Advanced Settings. These are separated because they only apply to specific metrics and not to other metrics in the report.
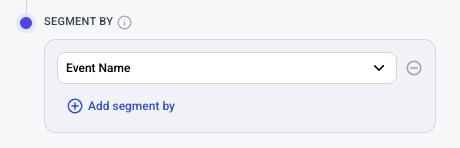
Segment By
Segment your data by a dimension.
- Select a dimension from the dropdown (e.g., "Cost Source," "Cost Campaign").
- When set, widgets will break data down by this dimension (e.g. showing separate lines for each campaign on a line chart).
- Set to "None" to remove the segment by.
- The available dimensions depend on your account data.
- You can set a secondary segmentation by clicking + Add segment by and selecting another option.
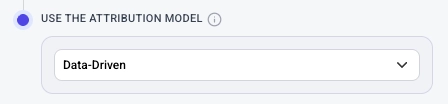
Attribution Model
Choose how conversion credit is distributed across touchpoints.
- Select a model from the "Use the Attribution Model" dropdown (e.g., "Data-Driven").
- This dropdown only appears if you choose “attributed” metrics such as Attributed {Stage} — influenced metrics are calculated independently of the model.
Advanced Settings
Click Advanced Settings at the bottom to access additional configuration options. These include. This a global sort that applies across the entire report.
Applying Your Configuration
After setting up the configurator:
- Click Apply at the bottom of the panel to generate or update the report's widgets.
- The report area on the right will populate with widgets based on your configuration.
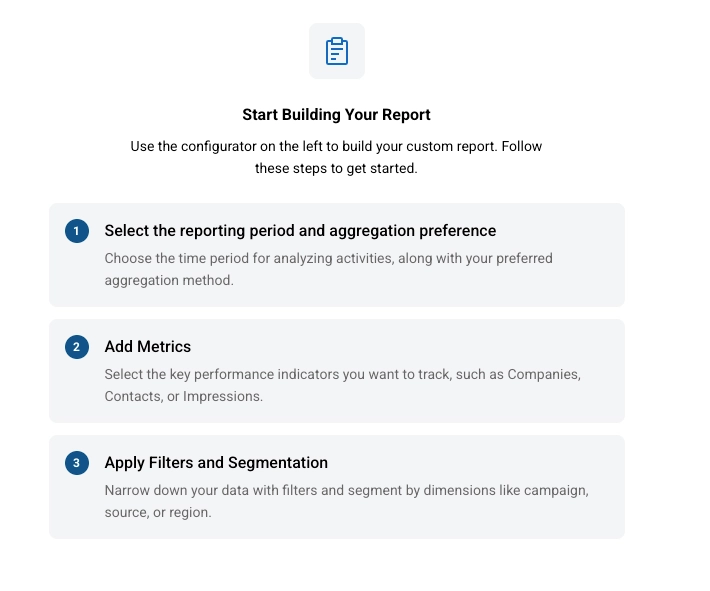
- If this is a new report, a "Start Building Your Report" describes the steps necessary to get started.
Tips
- If the configurator looks empty or unfamiliar, check which report type the report uses — different types show different fields.
- Use a template as a starting point. Templates pre-populate the configurator with relevant metrics, filters, and group by options for various use cases.
- Filter dimensions and values are loaded from the data in your Dreamdata account. If you don't see an expected option, verify that the relevant integration is connected and that data modeling has run. For example, if you attempt to filter by ‘LinkedIn Ad Set’ but the integration is not connected, there will be no filters.
- You can change any configurator setting at any time and click Apply again to update the report.