Capterra Ads
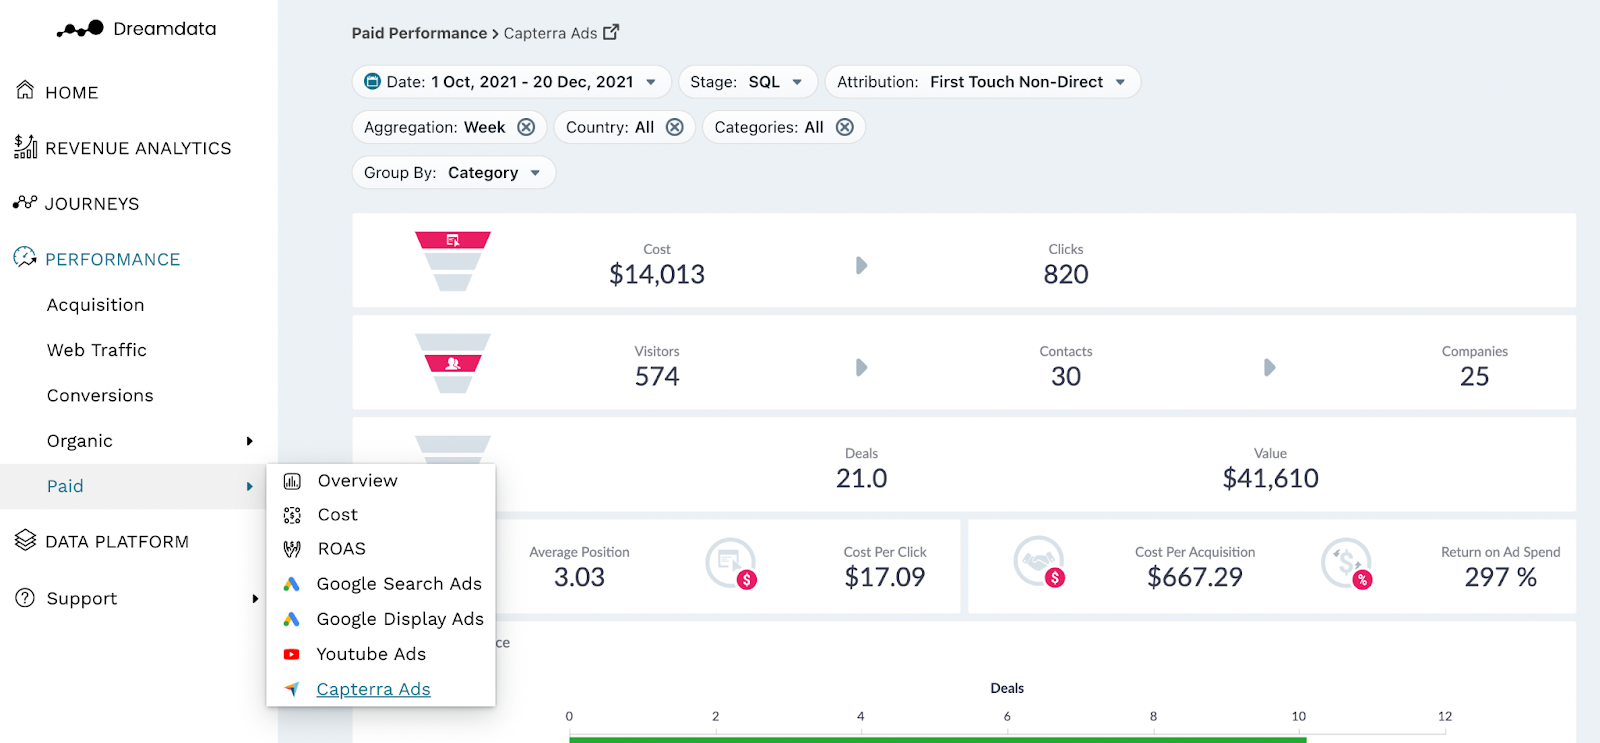
With this dashboard, we give users all the info they need to understand how their Capterra Ads are performing, particularly in regards to ROAS. From the overall funnel, down to category performance, you get the full perspective and can make data supported decisions and strategy.
Filters
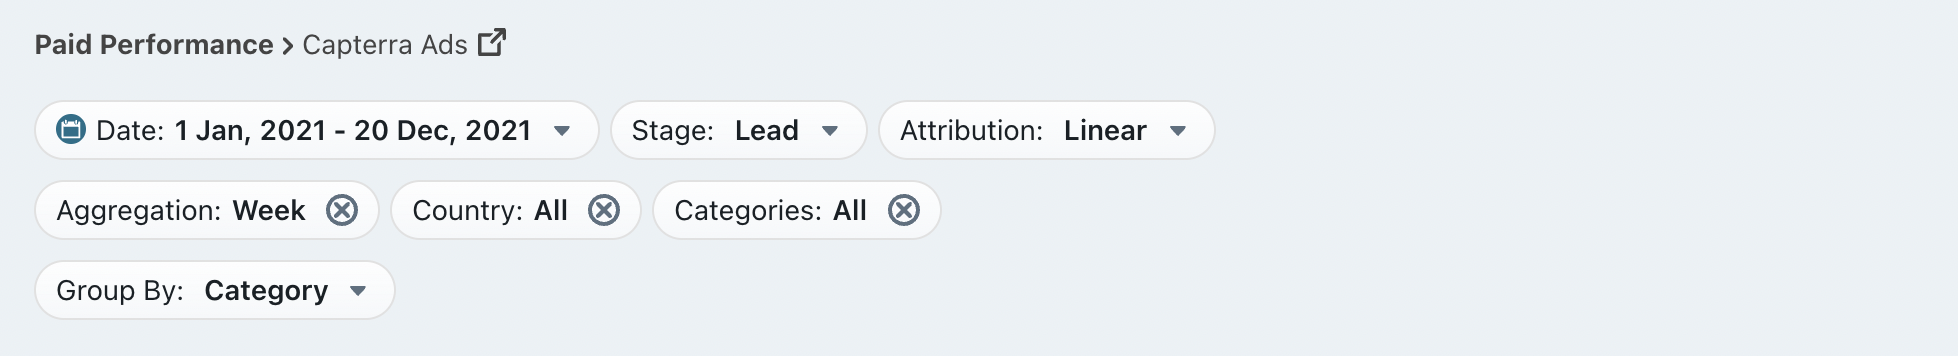
Date: Set the time period you want to investigate
Stage: You can select your preferred pipeline stage. Read more about the Free Tier Stages here
Attribution: Choose the attribution model which is meaningful for your analysis
- First Touch
- Last Touch
- Linear
- U-Shaped
- W-Shaped
Country: Choose the country you want to investigate
Categories: Choose the categories you want to analyse
Group By: Choose your preferred option
- Category
- Country
- Category Country
Note: Date is referring to the time period when visitors/contacts interacted with any Capterra Ads
Metrics
Cost: The total spend on Capterra Ads
Clicks: The total amount of clicks recorded by Capterra Ads
Visitors: The number of unique users who had a website session which originated from Capterra Ads during the given time period
Contacts: The number of visitors who we have been able to attach an email to their user id
Companies: The number of companies who are attached to Contacts, or the number of companies in your CRM who we can be attached to any visitor traffic (anonymous)
Deals: The number of deals that are associated with Capterra Ads based on your selected filter
Value: The amount of revenue that is attributed to the Capterra Ads based on your selected filter
Average Position: The position on a search engine results page. The sum of the average position index divided by the total of Impressions
Cost Per Click (cpc): Total Cost divided by Clicks
Cost Per Acquisition (cpa): Total Cost divided by Attributable Deals
Return on Ad Spend (ROAS): Total Attributable Revenue divided by Total Cost
Funnel Overview
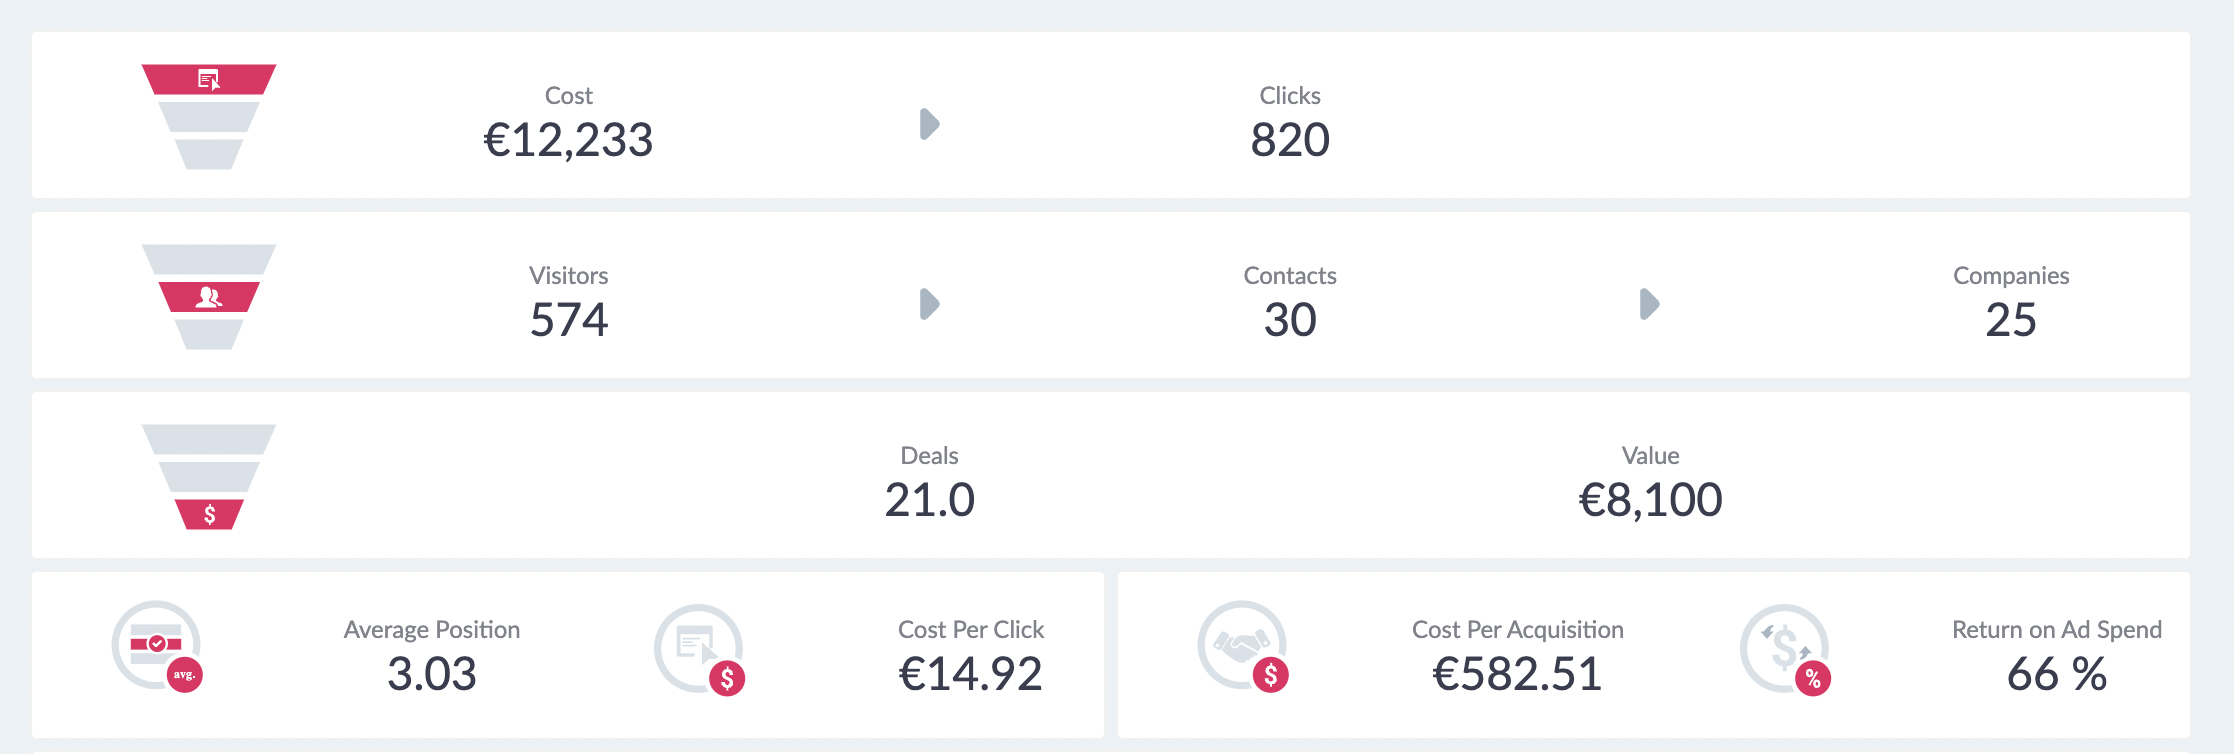
Cost → Clicks
In this first section, we provide the top of the funnel for your Capterra Ads for the given time period. This data is pulled directly from Capterra Ads through our integrations.
Visitors → Contacts → Companies
In the next section, we give an overview of the traffic from Capterra Ads which is based on the Tracking script we have on your websites.
Deals → Value
In the third section, we provide the total number of Attributable Deals and Attributable Value (revenue) that can be assigned to Capterra Ads based on the filters selected.
To calculate these numbers, we first look at the pool of contacts/companies that visited a Capterra Ad based on the dates/filters. Once we have that group, we see what deals were closed after their visit, up to today's date. More importantly, we are only looking at deals where we have a recorded history of sessions; Attributable Deals. This pool of attributable deals will make up the basis for this section. For each of these deals and all their sessions, we will run the Attribution Model you have selected so each session is given a deal and revenue amount.
For both Attributable Deal and Value (revenue), we then provide the sum of these amounts for each session that contains a Capterra Ad, depending on which Attribution Model you have selected.
Note: When using First Touch/Last Touch you will get a round Deal number, as a deal is either First Touch Paid or Not. While with Linear, W-Shaped or U-Shaped you will get a fraction of a deal as most Paid Touchpoints will make up a fraction of the sessions on a deal.
Average Position → Cost per Click → Cost per Acquisition → ROAS
On the fourth row, we provide percentages for some common KPIs, most important Return on Ad Spend.
Graphs and Tables
Category Performance
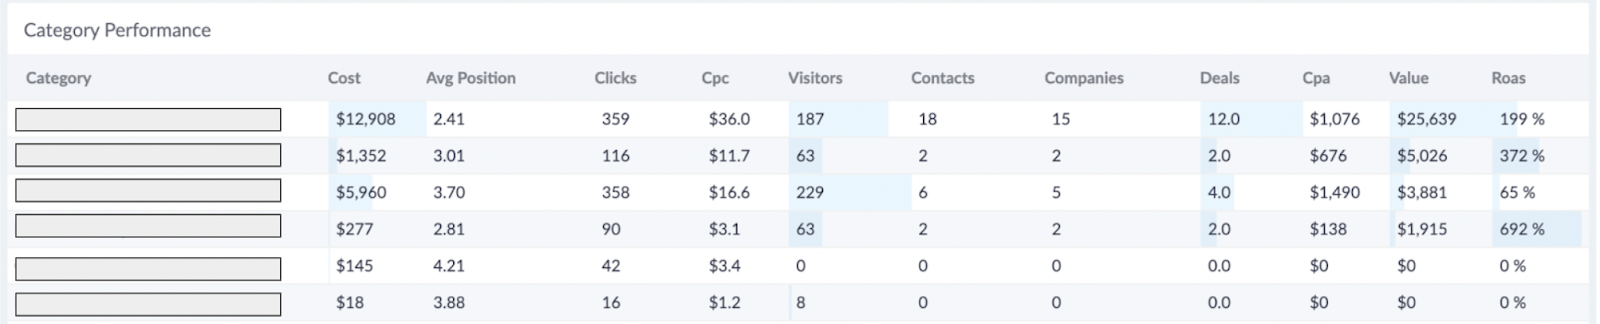
In this table, we list all the Categories that were running during the time frame specified. We provide all the metrics for each category making it easier for you to compare and find out which performed and which ones did not perform.
Country Performance
This report shows where your campaign click events happen, and which regions bring more value than others.
Note: You can open a larger view by clicking on the performance title in the top left corner
Category Performance over time
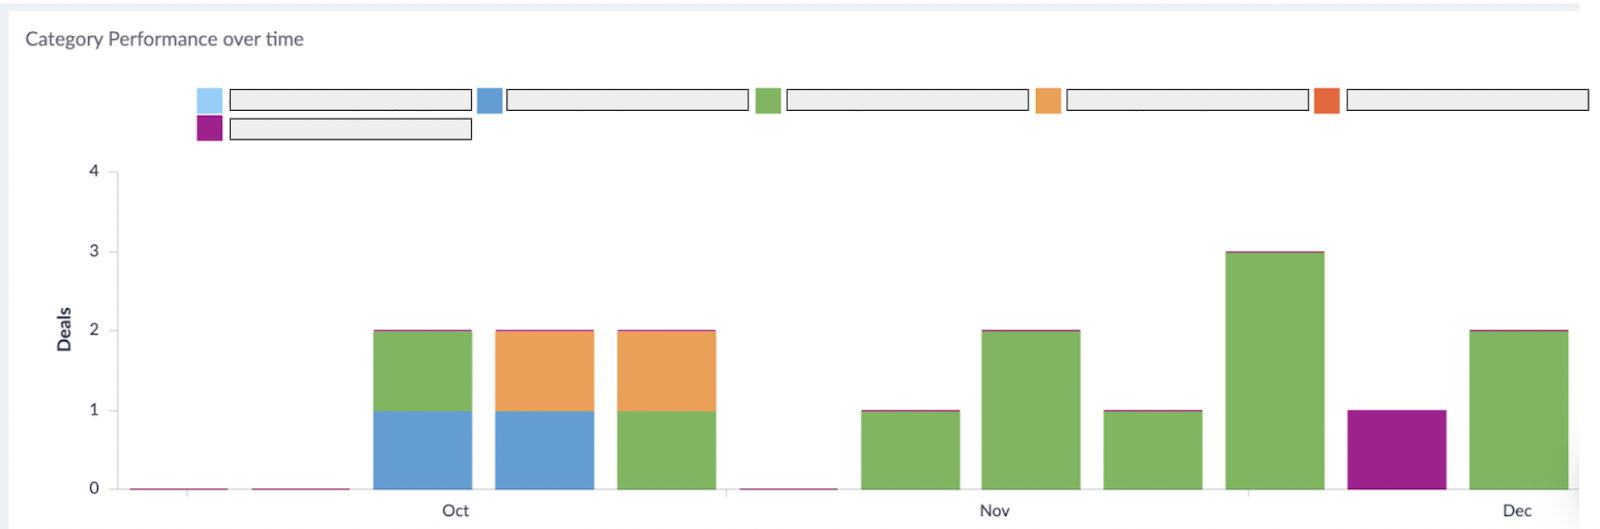
We then provide a graph showing the development of your Capterra Ad Categories and their generated deals over the period of time specified in your Filters. Use the Aggregate filter to breakdown the X-Axis as you wish e.g. (day, week, month).
This graph makes it easy to see which Category is performing best, but also it shows how long it generally takes for a campaign to win the deals. To do that, select a specific Category and set the Aggregation filter by days. This will allow you to get detailed analysis on unique campaigns.
Note: Time frame is key so you can give enough time to your campaigns to create value.