Dashboards
 Updated
by
Aleksandar Grbic
Updated
by
Aleksandar Grbic
A dashboard is a customizable page that combines widgets from different reports into a single view. Dashboards are ideal for creating executive KPI summaries, team-specific views, or for addressing any scenario where you want to see data from multiple reports at a glance.

Creating a Dashboard
- Navigate to the Analytics Hub home.
- Click Create Dashboard.
- In the upper left corner of the screen where it says Untitled Dashboard, give your dashboard a name by clicking that placeholder text and replacing it with your own at the top (e.g. "CMO Dashboard"). You can also can add a description by clicking the Add a description… and replacing it with your own text.

- Optionally add a description below the title.
Adding Widgets
There are two ways to add widgets to a dashboard:
From Within the Dashboard
- Click the Add widget button in the top-right corner of the dashboard.
- Clicking this allows you to browse available widgets from your saved reports or create a text widget.
- Select the widget(s) you want to add. Widgets get added to the dashboard in order, meaning that any new widgets will be added at the bottom of the dashboard.
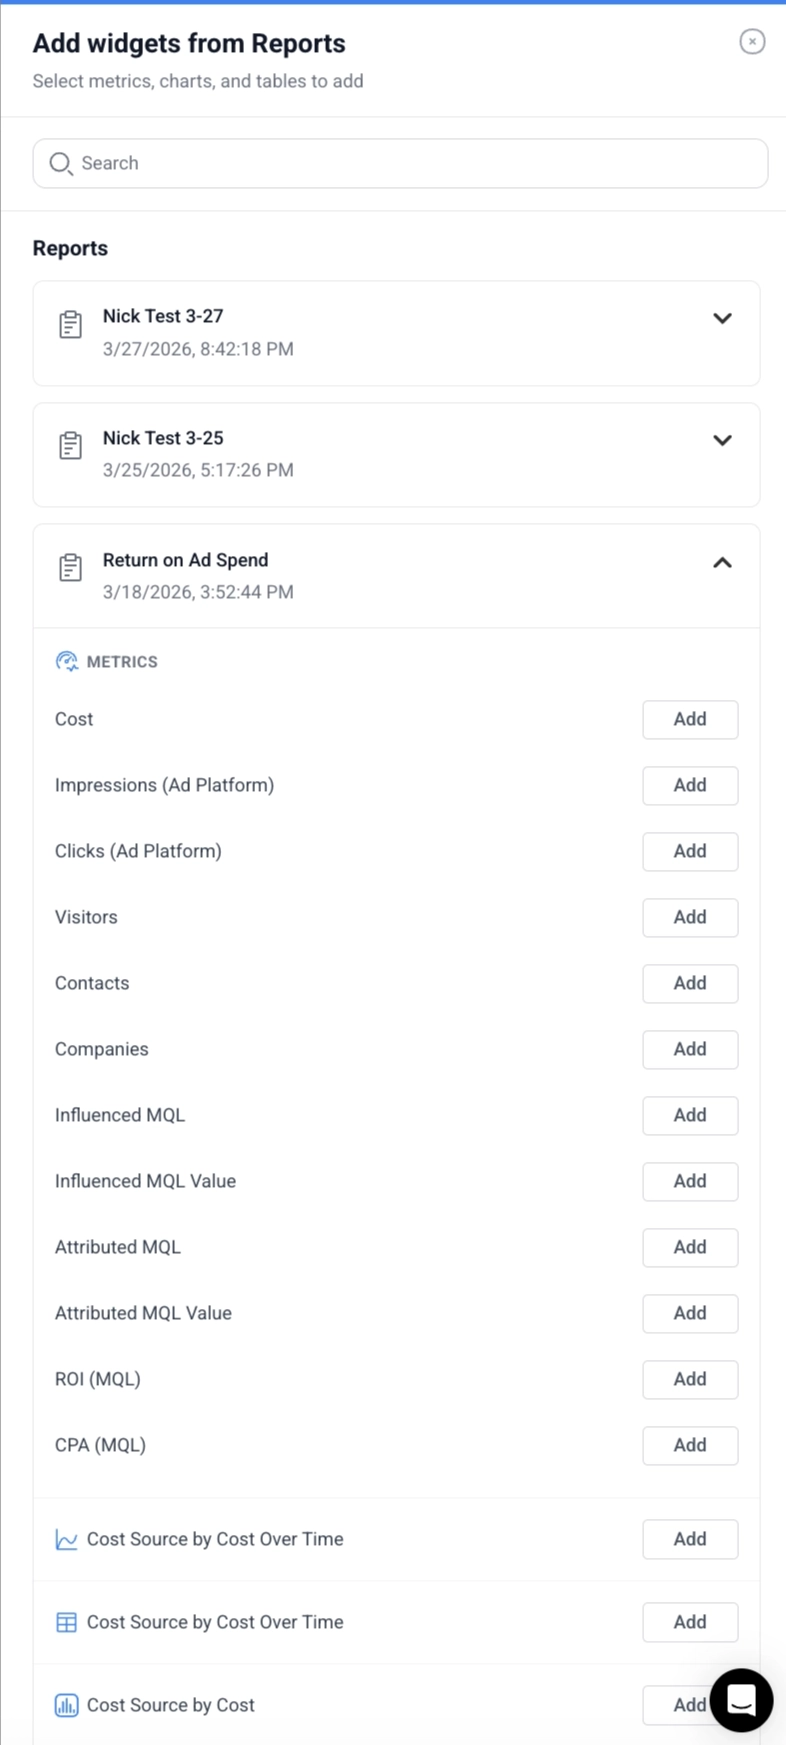
From a Report
- Open a report that contains the widget you want.
- Click the three-dot menu (⋮) on the widget.
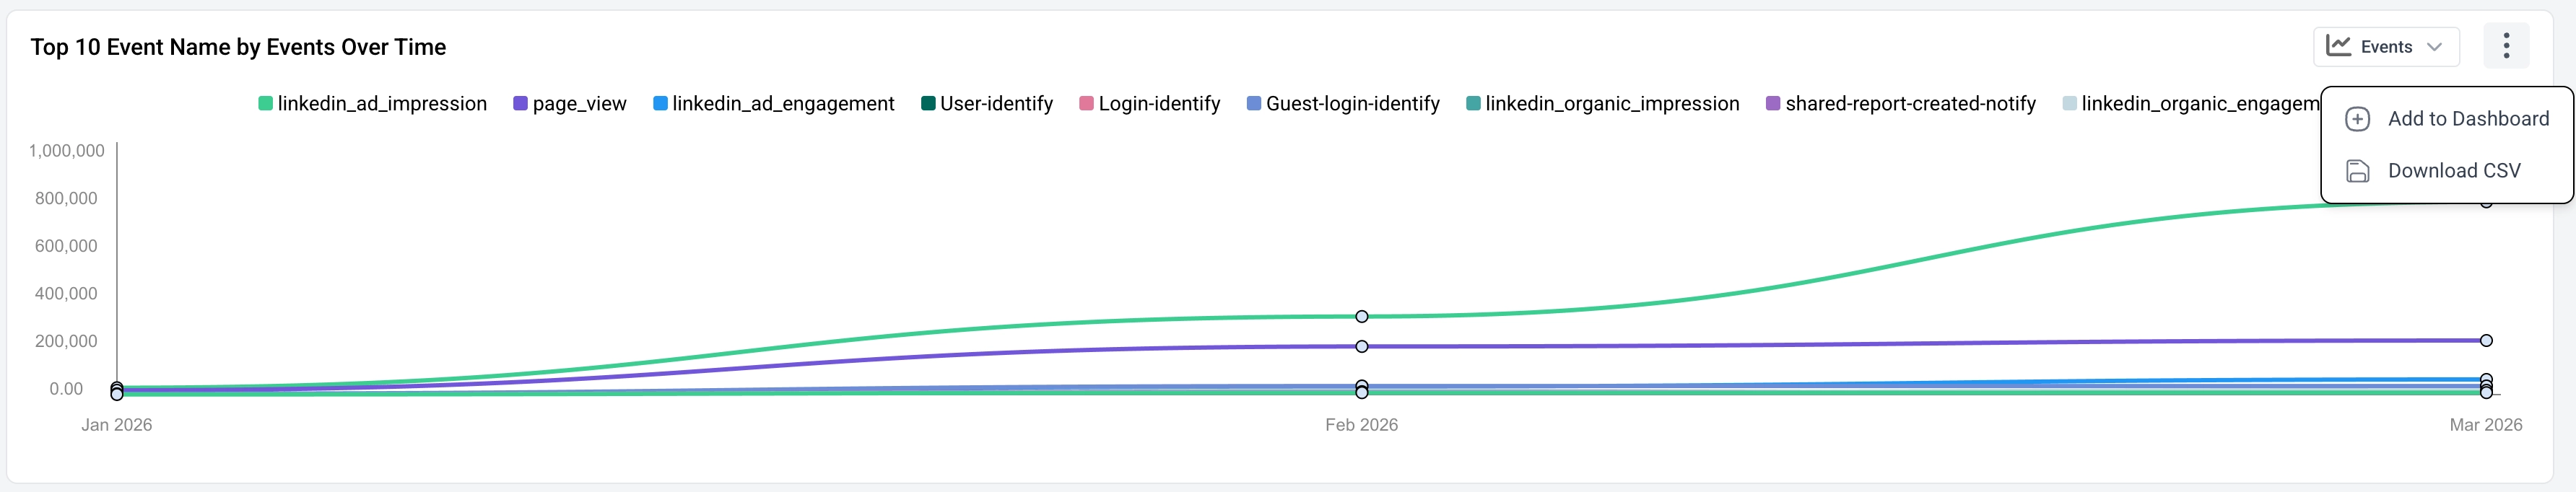
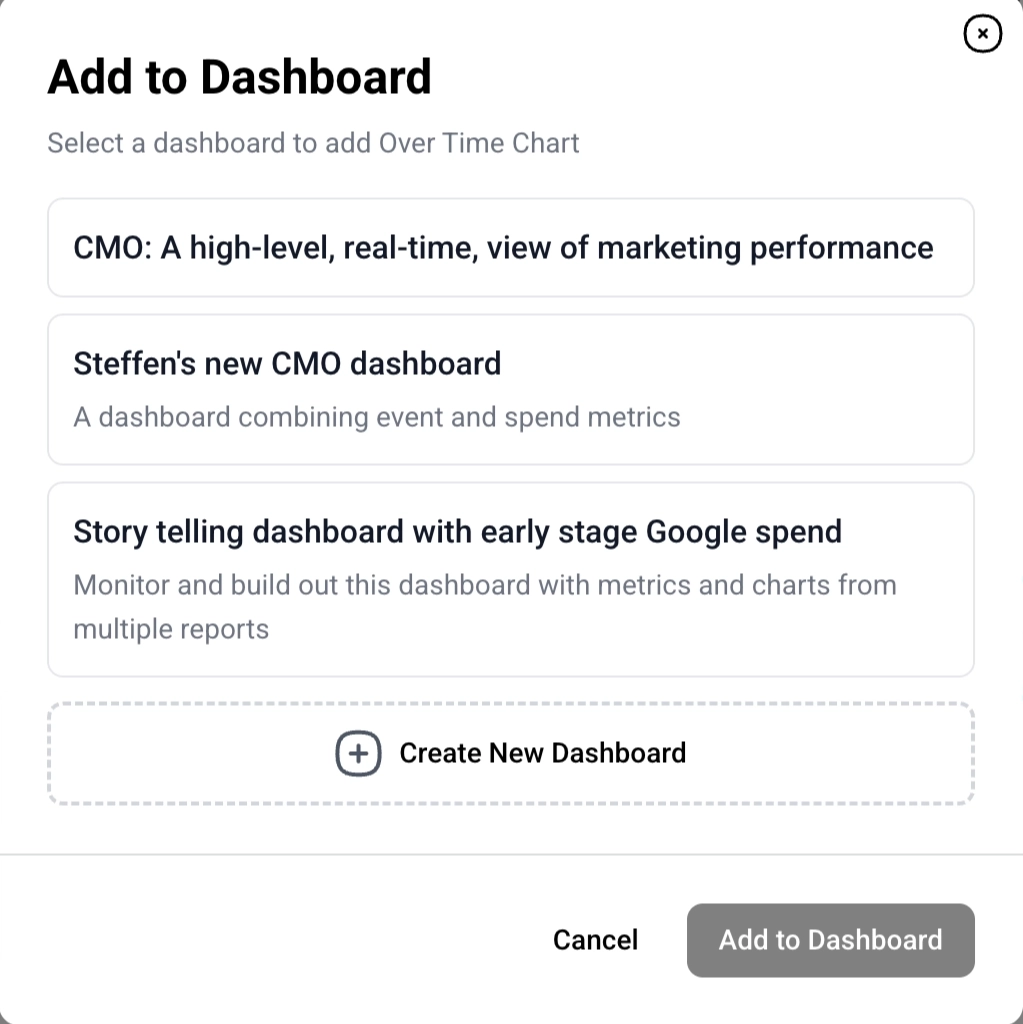
- Select Add to Dashboard.
- Choose the target dashboard or create a new dashboard.
See the Widgets guide for more on widget types and customization.
Understanding Dashboard Widgets
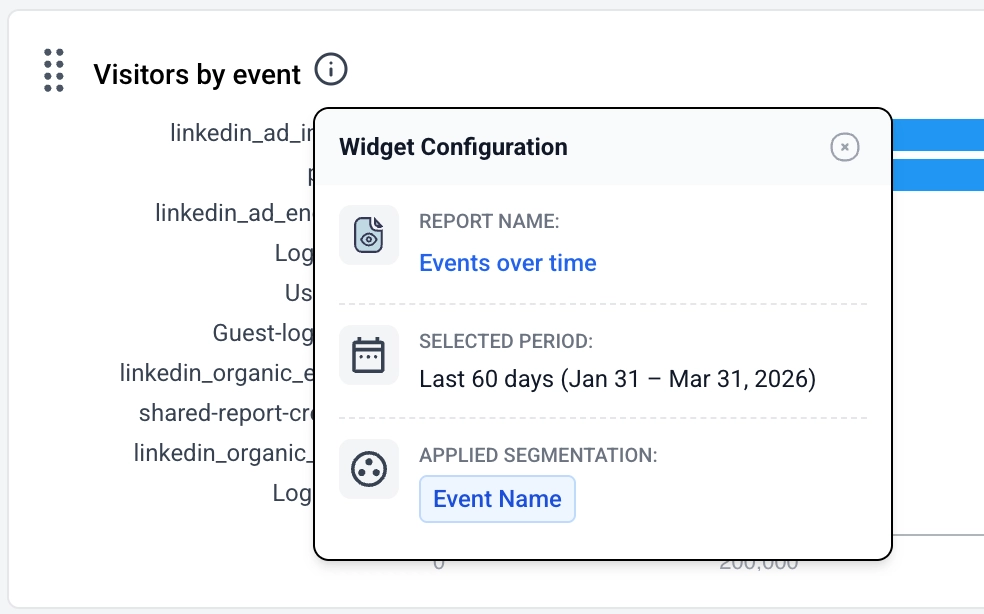
Widgets on a dashboard reference their source report. This means:
- The widget displays data based on the source report's configuration. The available metrics, the date range, the filters applied and the segmentation are all taken from the source report. It’s possible to see which report the widget comes from and which segmentation is applied by hovering over the info icon next to the widget’s name.
- Widget titles can be configured on the dashboard.
- If the source report is updated, the dashboard widget reflects those changes.
Organizing Your Dashboard
- Widgets are displayed in the order they were added.
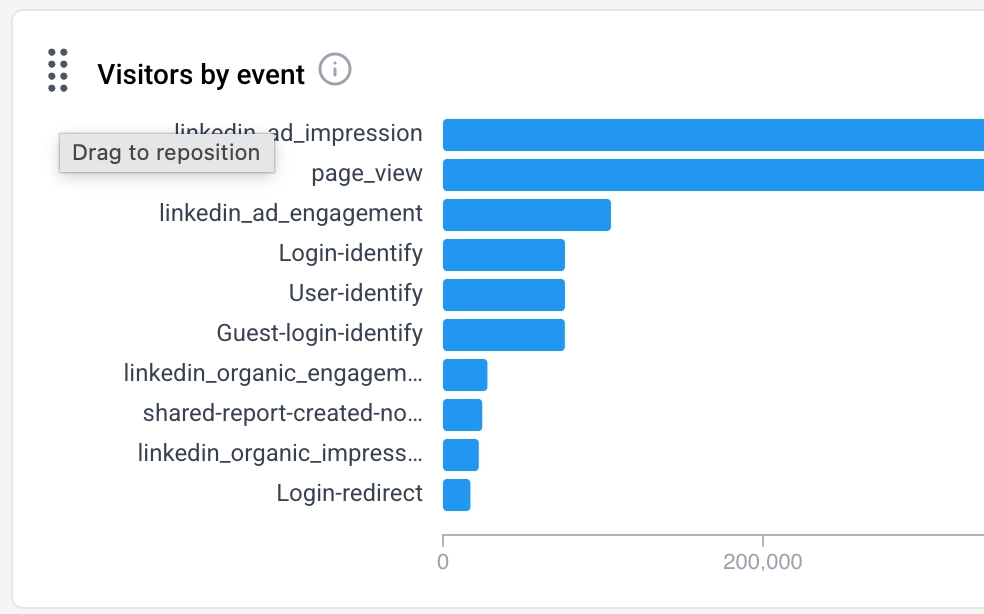
- You can rearrange widgets by dragging and dropping them. To drag and drop a widget, mouse over the upper left hand corner of the widget and drag it.
- Mix and match widget types — metric cards, graphs, bar charts, and tables — to create the view that works best for your needs.
Sharing a Dashboard
- Click the Copy Dashboard Link button in the top-right corner to copy a shareable link.

- Anyone with access to your Dreamdata account can view the dashboard via this link.
Saving a Dashboard
- Click Save Dashboard in the top-right corner to save your changes. If make changes and leave the dashboard page before saving, your changes will be lost. You will receive a warning before leaving the page.
- Saved dashboards appear in the Analytics Hub home.
Tips
- Build dashboards around a specific audience or use case — e.g., a "Weekly Executive Summary" or a "Paid Channels Performance" dashboard.
- Use metric cards from different reports to create a row of top-level KPIs at the top of your dashboard.
- Dashboards update automatically as their source reports are updated, so they always show the latest data.