Streamline Your Revenue Analysis: Visualize all your revenue data in one place by using BigQuery Export
By the end of this guide, you'll be able to:
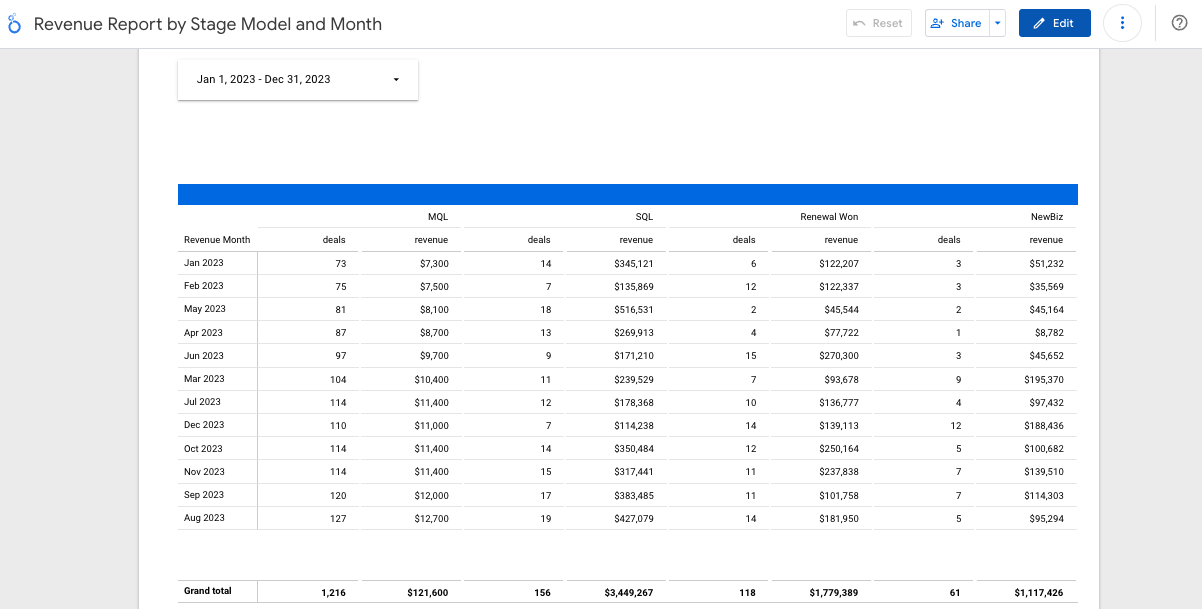
retrieve a table with the number of deals and stage amounts for all stage models
visualize the data in one simple report using Bigquery Data connected to Looker Studio
In this step-by-step guide we will show you how to consolidate and visualize your revenue data using Dreamdata’s BigQuery Data Export connected to Looker Studio.
This article will guide you through creating a comprehensive report that presents monthly revenue data across all Stage Models defined within Dreamdata.
Prerequisite: You need to have access to Dreamdata with a plan that includes Google BigQuery Data Warehouse.
If it's your first time using Dreamdata’s BigQuery Data Export, we recommend that you start by learning more about how to get access to it here.
Step 1: Querying Your Data in BigQuery
Accessing Your Data:
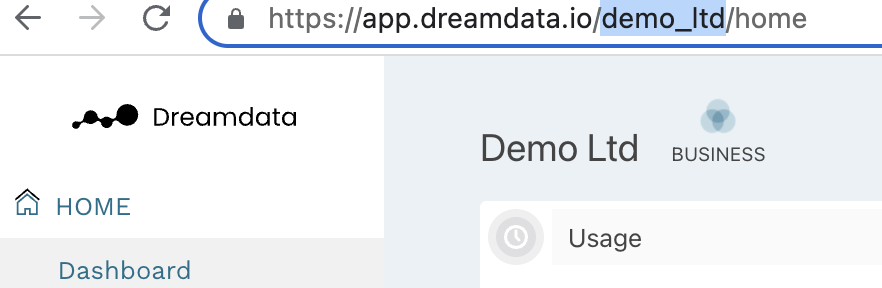
Navigate to the BigQuery Console and ensure you have visibility over the dreamdata project. In this project, you should see a dataset with your Dreamdata slug. You can find your slug logging into app.dreamdata.io and looking at the URL:If you encounter any issues or if you can't see the data, watch this video to understand why you might encounter problems.
Now you can test your access with a simple query like: SELECT * FROM dreamdata.demo_ltd.revenue LIMIT 1. Replace demo_ltd with your dataset name, which corresponds to your Dreamdata slug.
Fetching Revenue Data:
The data we will use to build the Revenue Report that is stored in the revenue table.
The revenue table contains a list of deals where a deal is defined as reaching the goal of a stage model. This can be deals/opportunities created or won, or earlier stages that you have set up. You defined how we should count for deals in the Stage Model configuration in Dreamdata's application.
To build the Revenue Report, utilize the following query structure to segment your data by month and by Revenue/Stage Model:
SELECT
   DATE_TRUNC(DATE(revenueTimestamp), MONTH) as revenue_date,
   revenueModel,
   round(sum(revenue),2) as revenue,
   count(distinct dealId) as deals
FROM
   dreamdata.demo_ltd.revenue
WHERE
   DATE(revenueTimestamp) >= '2023-01-01'
   and DATE(revenueTimestamp) <= CURRENT_DATE()
GROUP BY
   DATE_TRUNC(DATE(revenueTimestamp), MONTH),
   revenueModel
Step 2: Visualizing Data in Looker Studio
Creating Your Report
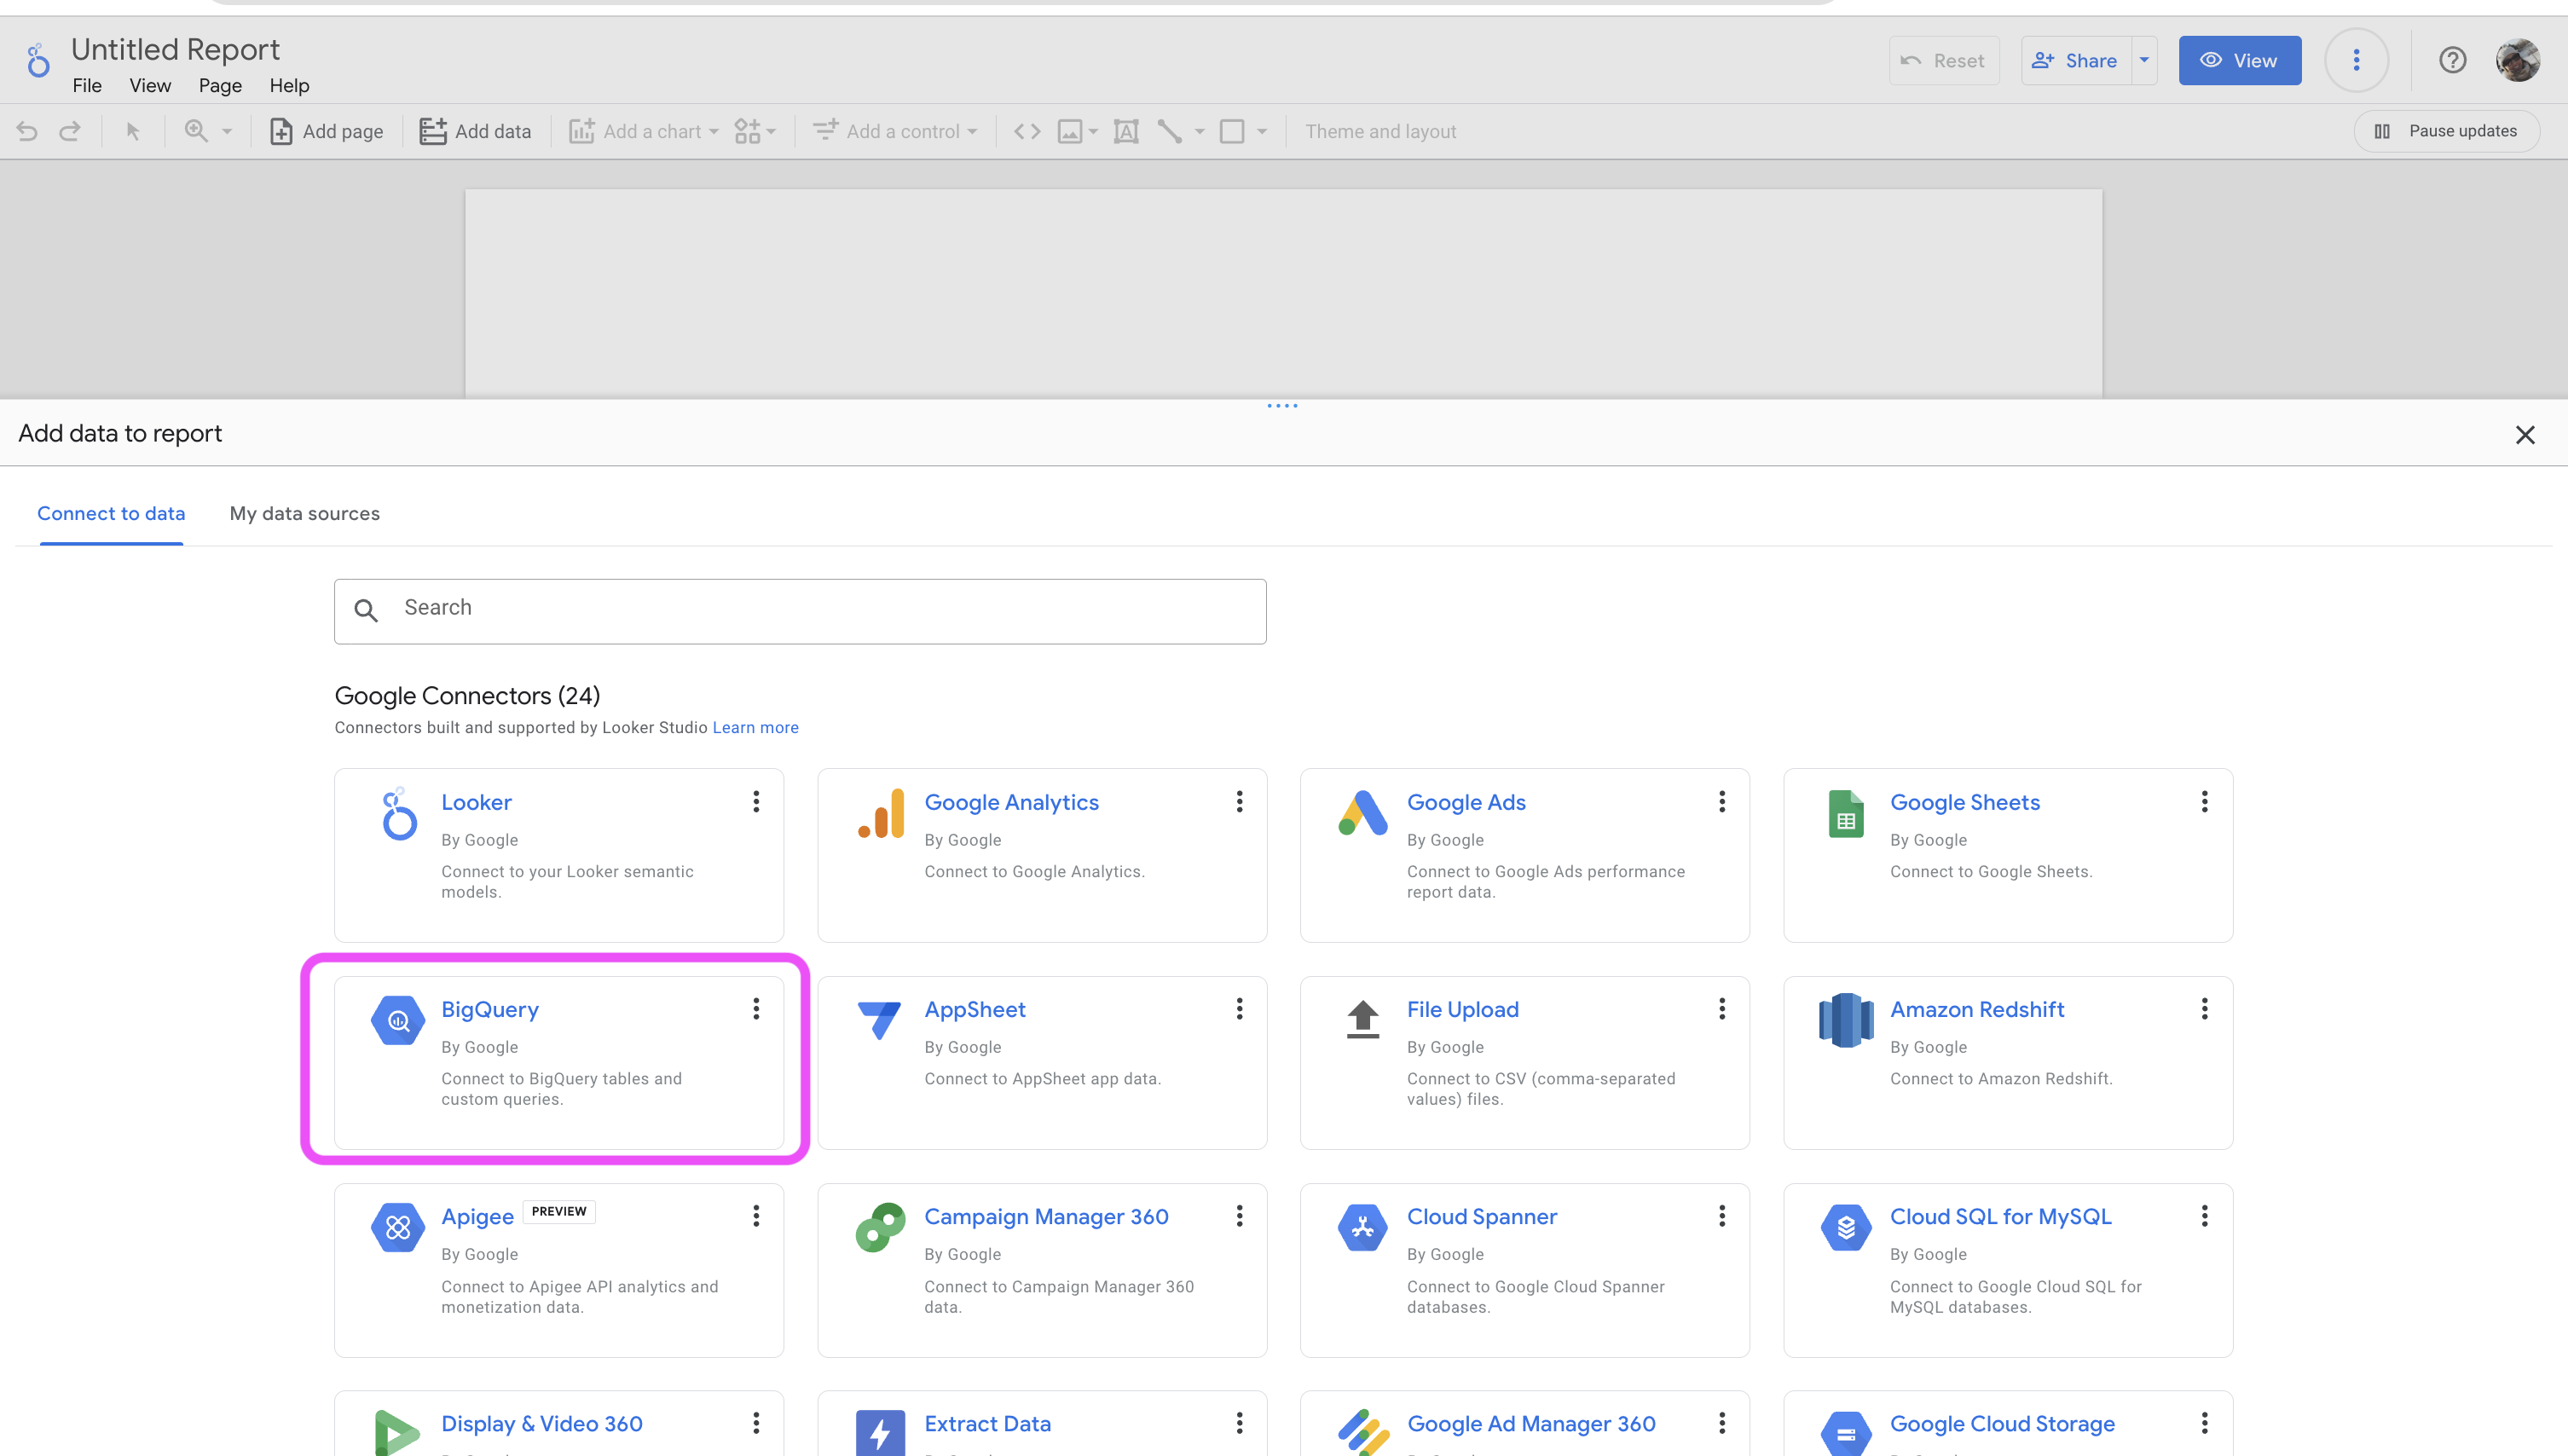
Head over to Looker Studio and create a blank report.
You will be prompted to add a data source, you need to select BigQuery.
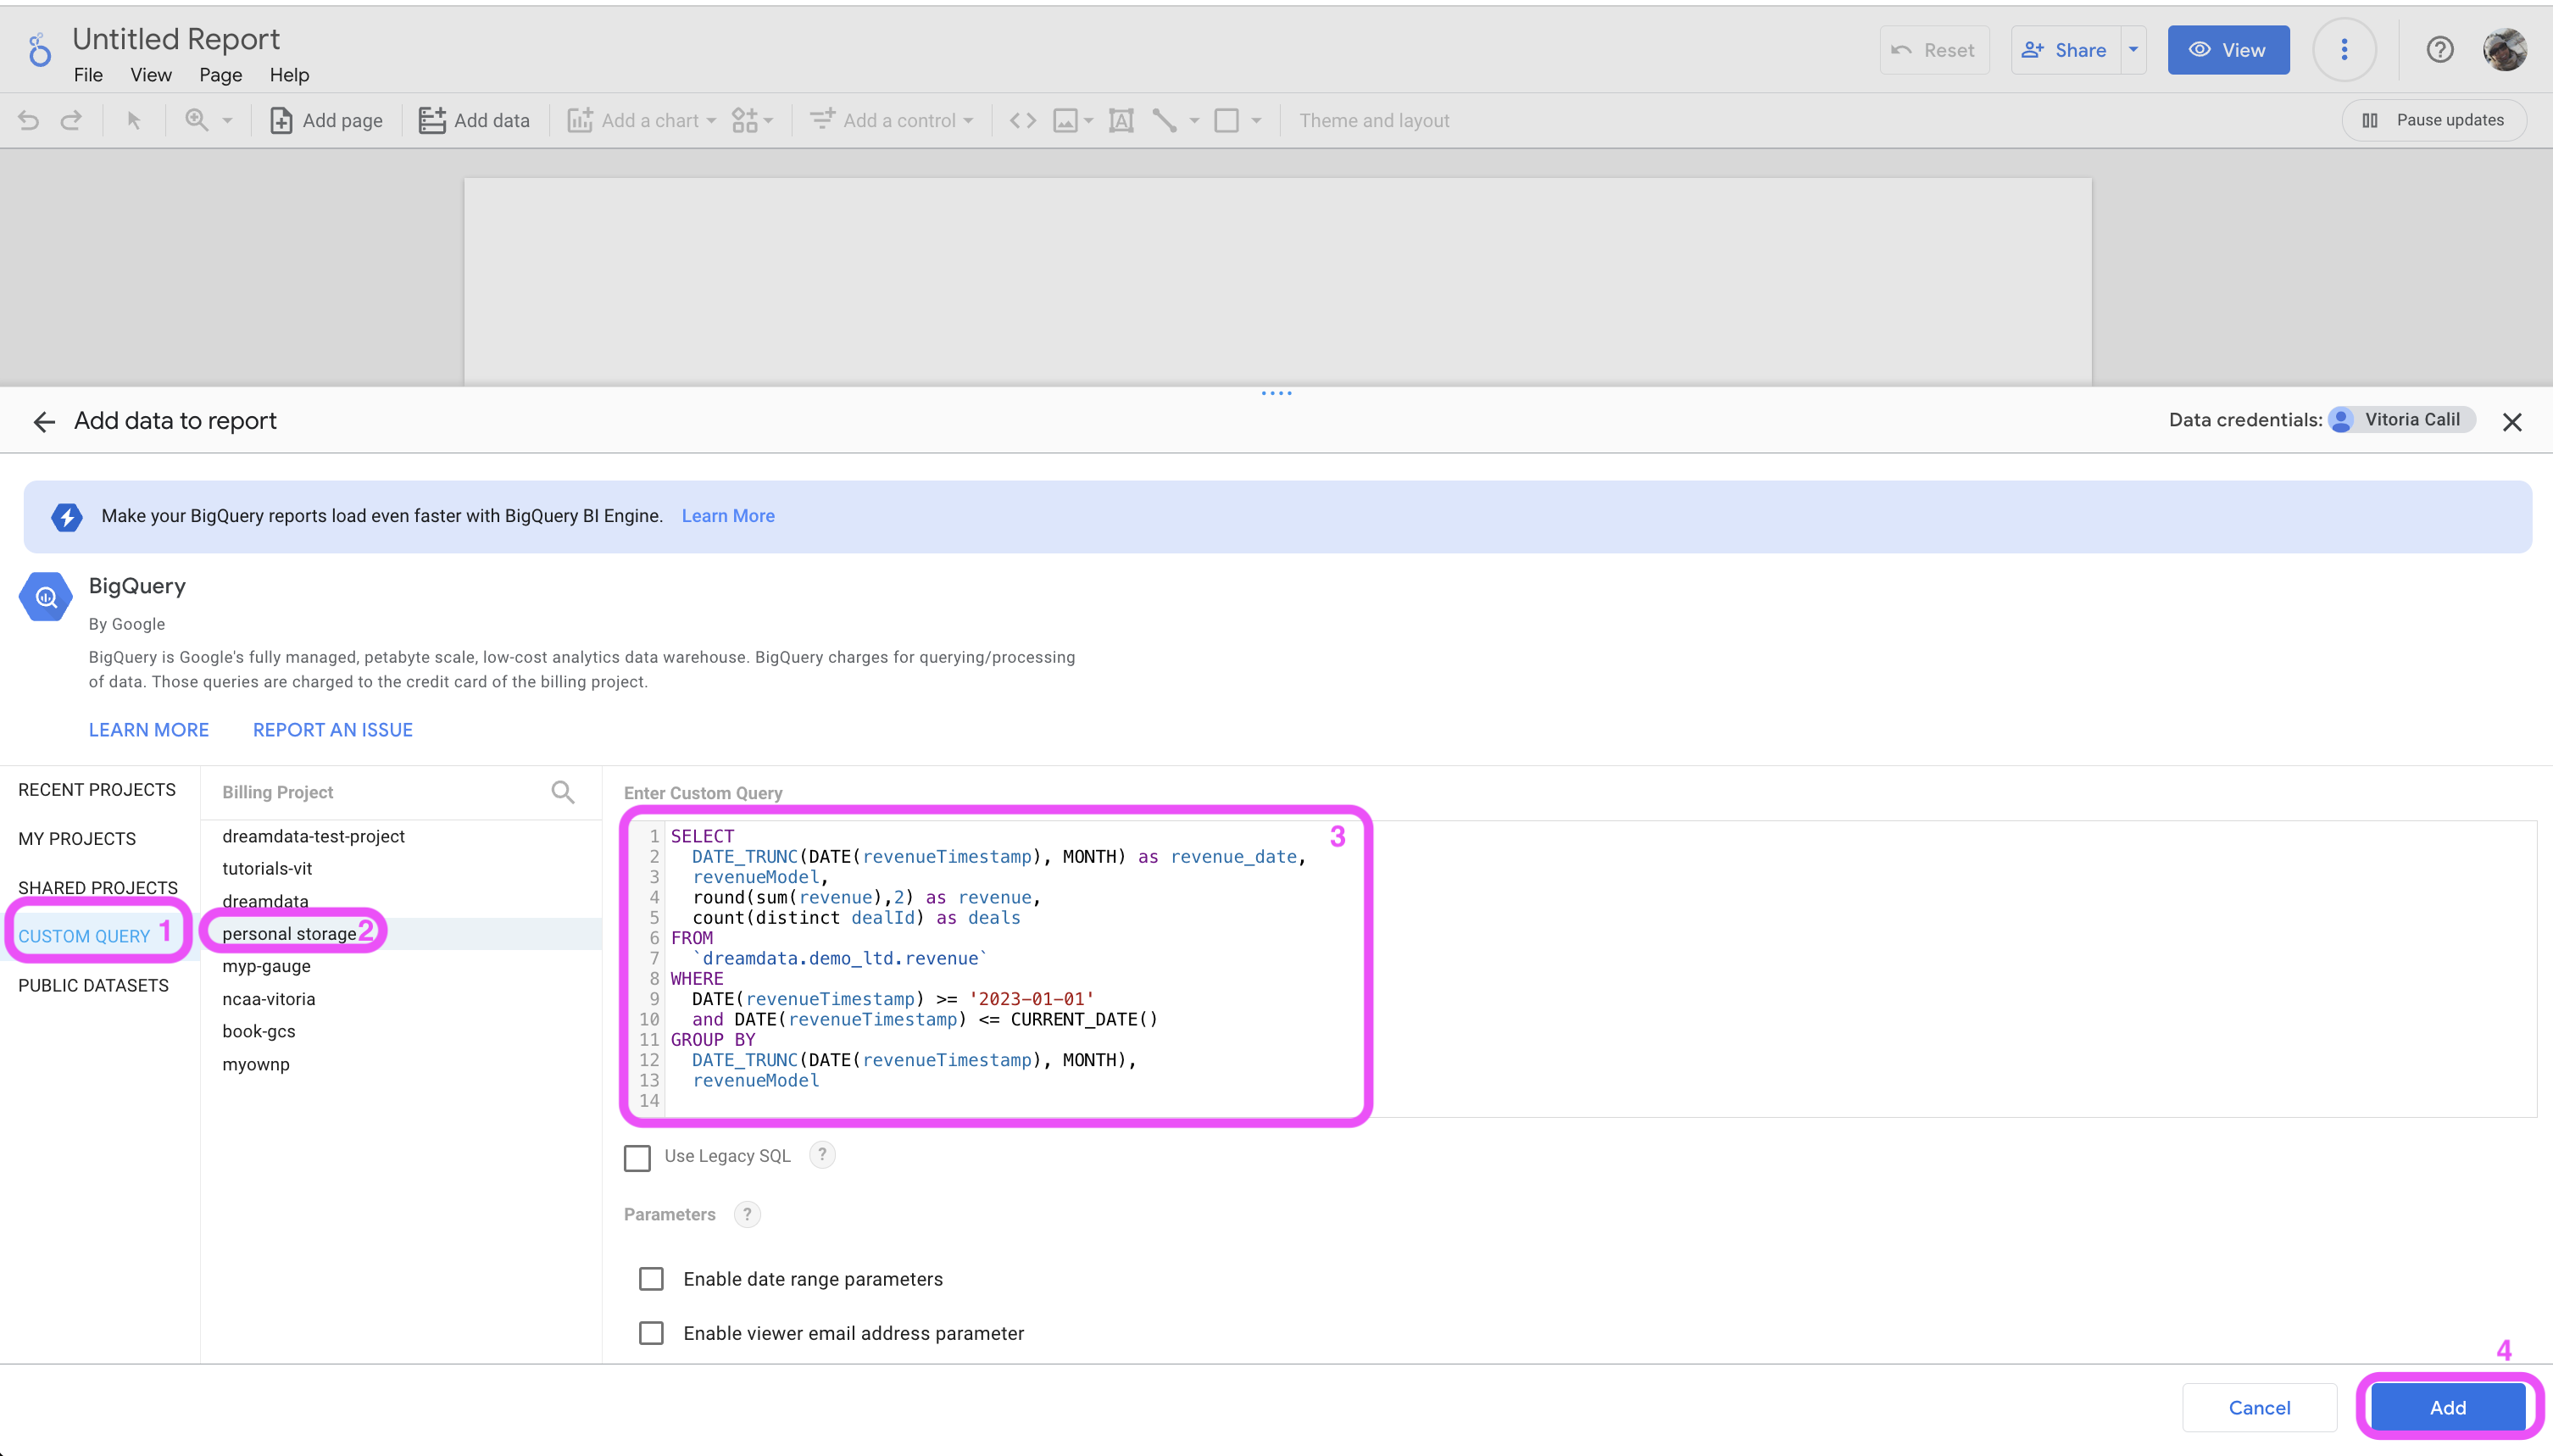
Proceed to "Custom Query", and use a project that you have billing access to for querying, in my case I am using a project named "personal-storage". Paste the query in the Custom Query field. Click add and you will need to confirm that you want to "Add to Report".
Configuring Your Report
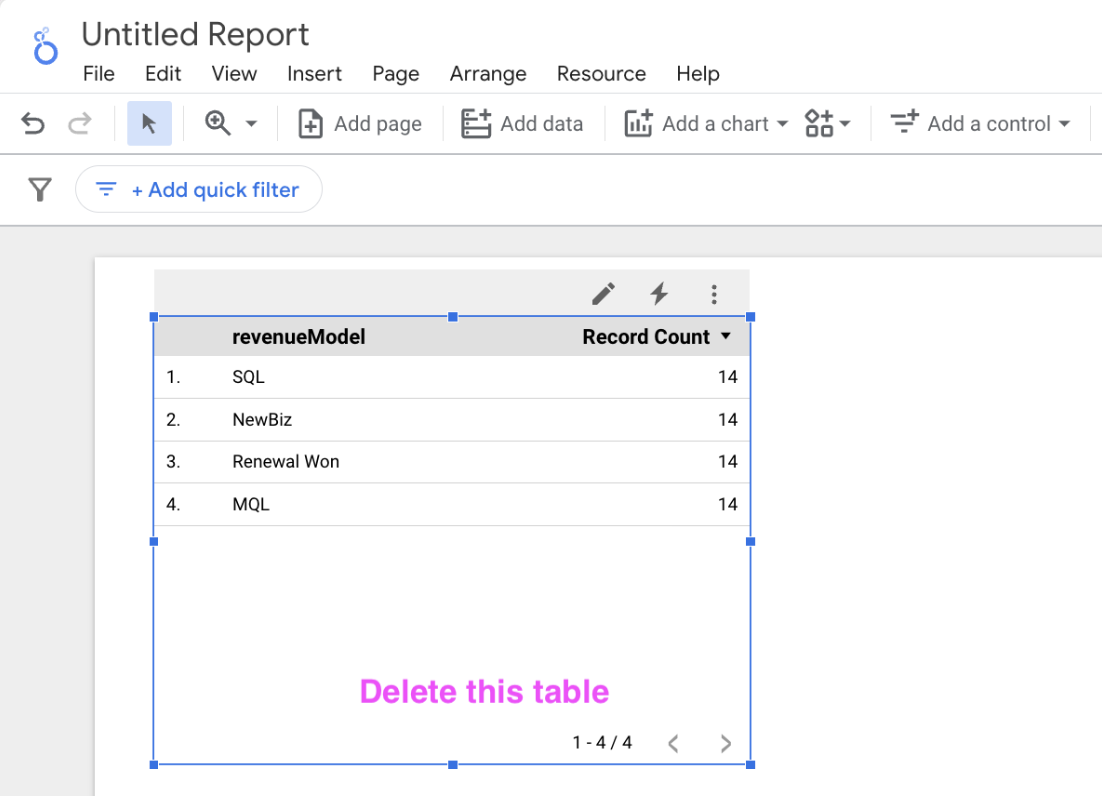
After adding the data source, delete the automatically generated table.
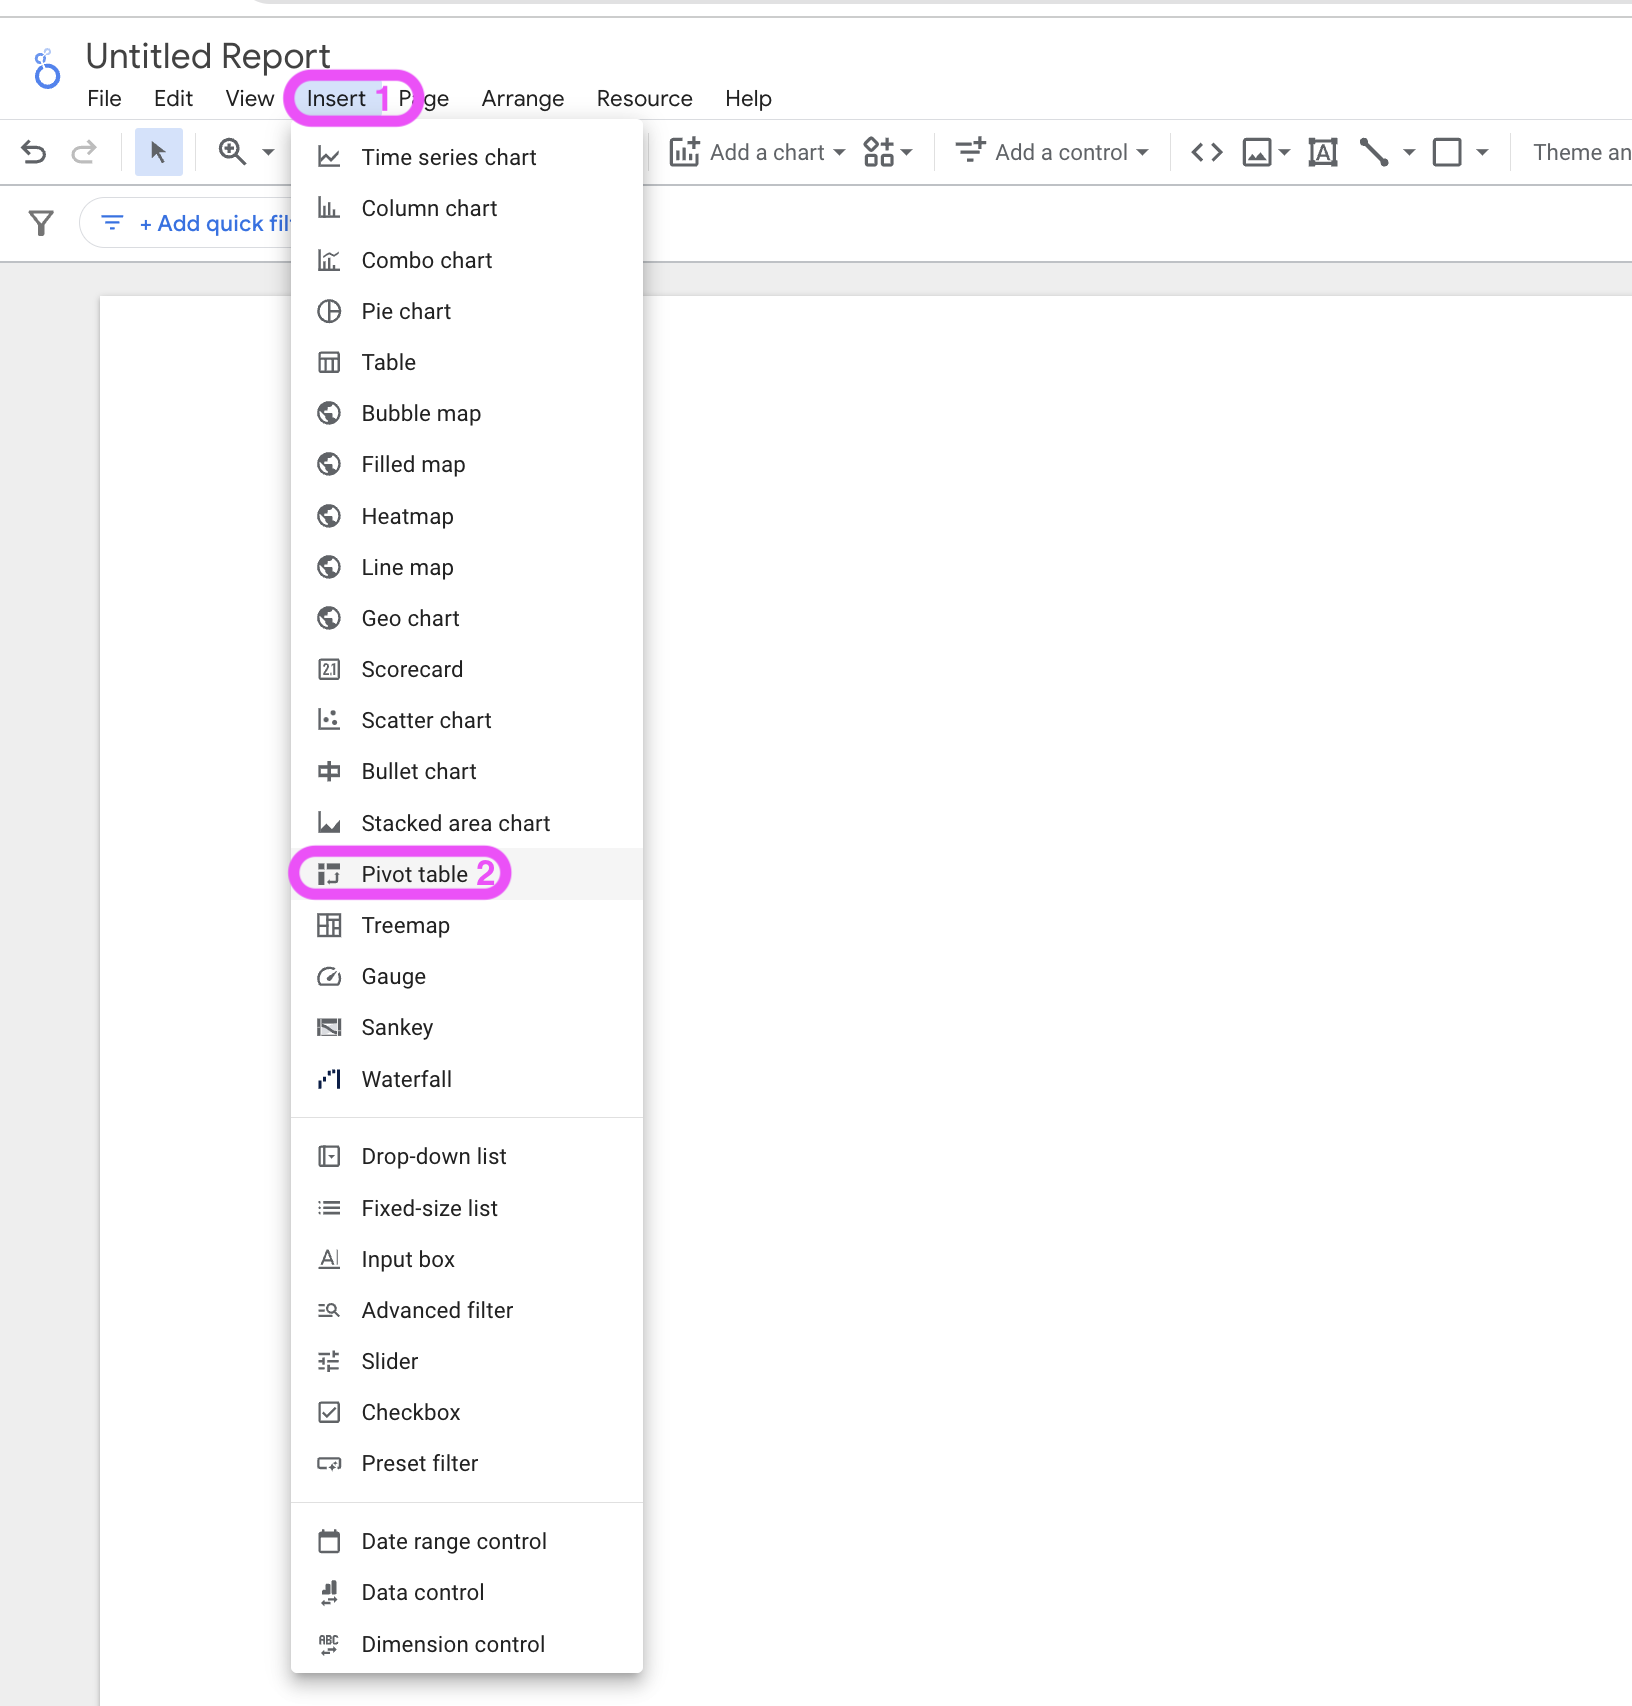
Insert a Pivot Table to display your data efficiently. Configure it as follows:
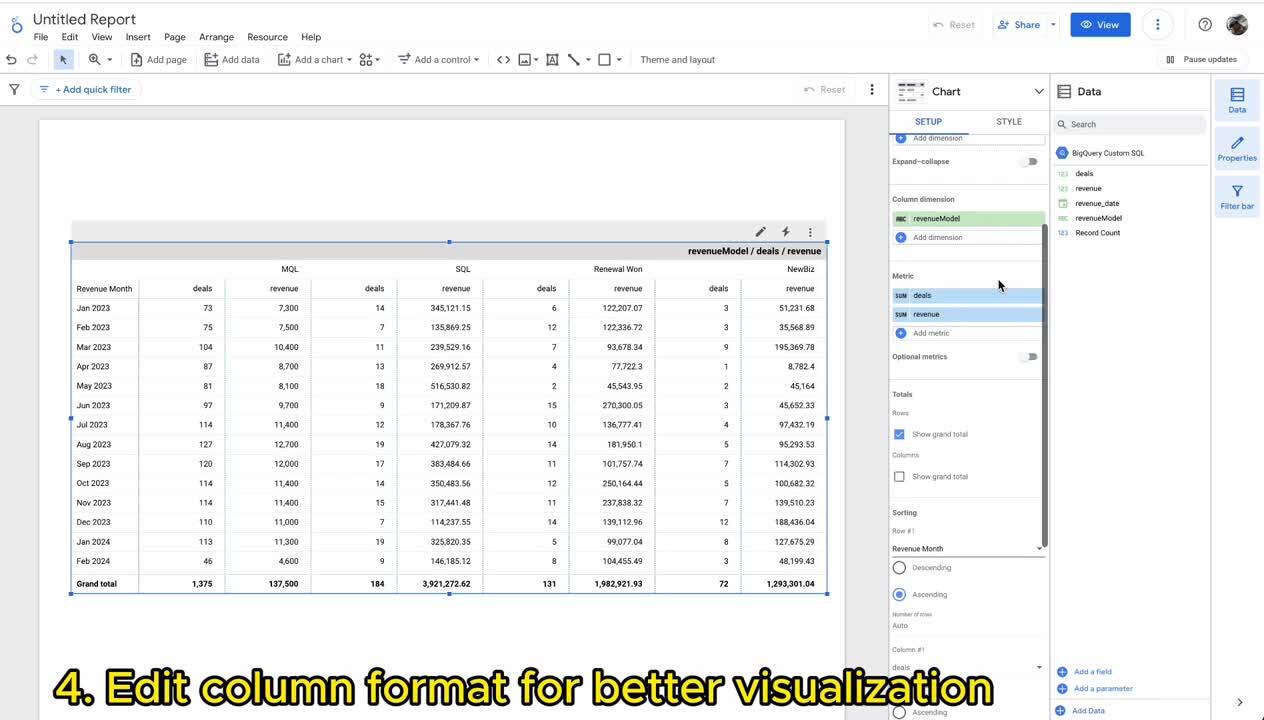
Row Dimension: revenue_date
Column Dimension: revenueModel
Metrics: SUM deal, SUM revenue
Format your report to make it look better Making your report more visually appealing is crucial for effective data analysis. The following video is just an example of how you can format the report to adjust metrics names and format columns.
By following these steps, you should now have a report that aggregates all your revenue data in one view, making it easier to analyze data.
We are always here to help so please reach out to friends@dreamdata.io with any questions or requests!