Build your own Revenue Attribution report in BigQuery
By the end of this guide, you will be able to:
- Build a report that provides a granular view of your revenue attribution by channel, offering insights into the performance of each channel across different stage models.
- Visualize your revenue attribution data in a single report using Bigquery data connected to Looker Studio.
Introduction
The Revenue Attribution report allows you to assess the origins of leads, opportunities, and deals, and analyze them. Data in this report can help you report on and plan your marketing and sales strategies.
If you want to build custom analysis and visualizations beyond what's available in Dreamdata’s app, you can use the Bigquery export data to build custom analysis.
This guide will walk you through using Dreamdata's Bigquery Export Data to create a revenue attribution report, showing you how to visualize attribution across all stages and channels in one unified view.
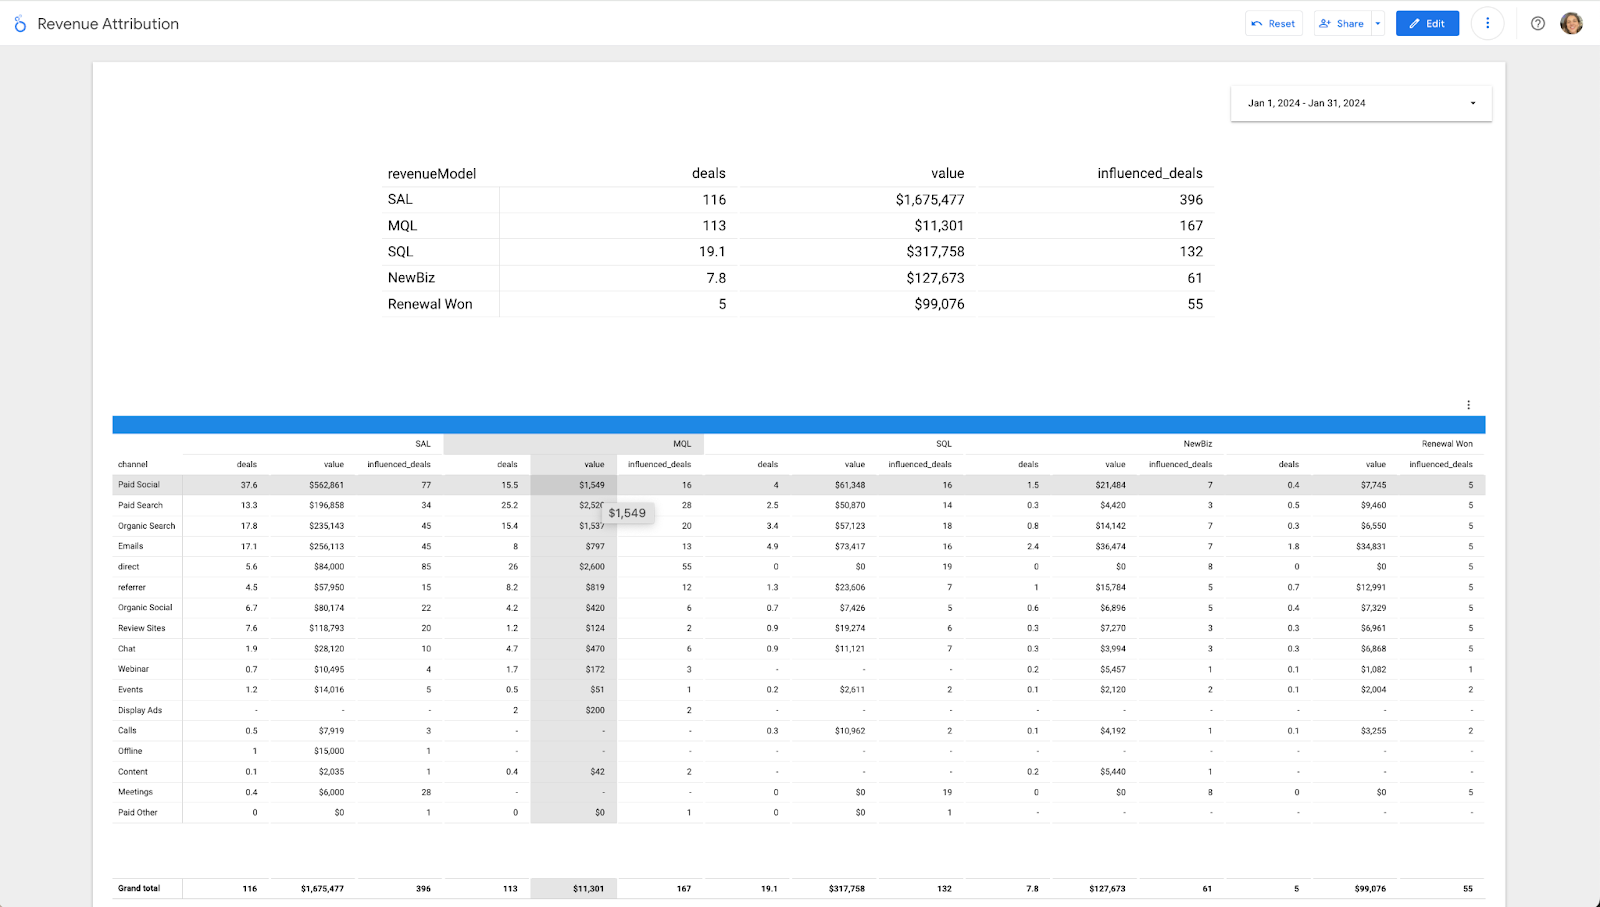
After following this guide you will be able to replicate the following report in Looker Studio with your data.
- You need to have access to Dreamdata with a plan that includes Google BigQuery Data Warehouse.
- You need to have stage models defined within Dreamdata. If you need assistance, refer to our guide on setting up stage models.
Step 1: Accessing and Querying Your Data
If you're new to Dreamdata's Bigquery Export, we recommend starting with our introductory article and then moving on to a more simple example of how to build a Revenue Report using Biquery data.
The revenue_attribution table is your primary data source for building the revenue attribution report.
This table contains sessions that have been given any attribution for any attribution model and any revenue model.
You can use the revenue_attribution table to find the attributed sessions for deals in a specific period and with that generate attribution for channels, sources, and other session characteristics.
1.1 Accessing Your Data
Navigate to the BigQuery Console and ensure you have visibility over the dreamdata project.
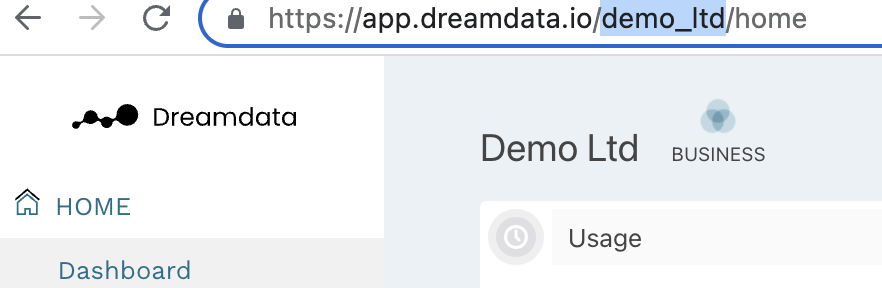
In this project, you should see a dataset with your Dreamdata slug. You can find your slug by logging into app.dreamdata.io and looking at the URL:
If you encounter any issues or if you can't see the data, watch this video to understand why you might encounter problems.
Now you can test your access with a simple query like:
SELECT * FROM dreamdata.demo_ltd.revenue_attribution LIMIT 1
Replace demo_ltd with your dataset name, which corresponds to your Dreamdata slug.
1.2 Querying Attribution for a Single Stage Models: A Basic Example
In this section, we'll delve into the revenue_attribution table, and learn/review concepts that are crucial when work with this table.
For those new to this data, here’s what you need to know:
If it's your first time manipulating the data in this table, here’s what you need to know:
- A single row in the
revenue_attributiontable corresponds to a session attributed to a specific stage model and attribution model. - Important: Each session is listed multiple times to account for different stage models and attribution models. Therefore, when using its data you must specify the stage model and attribution model in your queries to ensure accurate data retrieval.
This guide focuses on analyzing a Data-Driven attribution model and in this first example we want to see values for the MQL stage model only.
The following query is designed to calculate the number of deals, their value, and influenced deals specifically for the MQL stage model under the Data-Driven attribution model for January 2024.
  SELECT
    ROUND(IFNULL(SUM(attributableDeal), 0.0), 1) AS deals,
    ROUND(IFNULL(SUM(attributableRevenue), 0.0), 0) AS value,
    ROUND(IFNULL(COUNT( DISTINCT(dealId) ),0), 0) AS influenced_deals
  FROM
    `dreamdata.demo_ltd.revenue_attribution`
  WHERE
    attributionModel = 'Data-Driven'
    AND revenueModel = 'MQL'
    AND date(revenueTimestamp) >= '2024-01-01'
    AND date(revenueTimestamp) <= '2024-01-31'
This query serves as a foundation so you can familiarize yourself with the structure and data within the revenue_attribution table.
By matching and validating the results obtained from this query against the Dreamdata Revenue Attribution report, you'll gain insights into the accuracy and reliability of your data analysis. (See screenshot below)
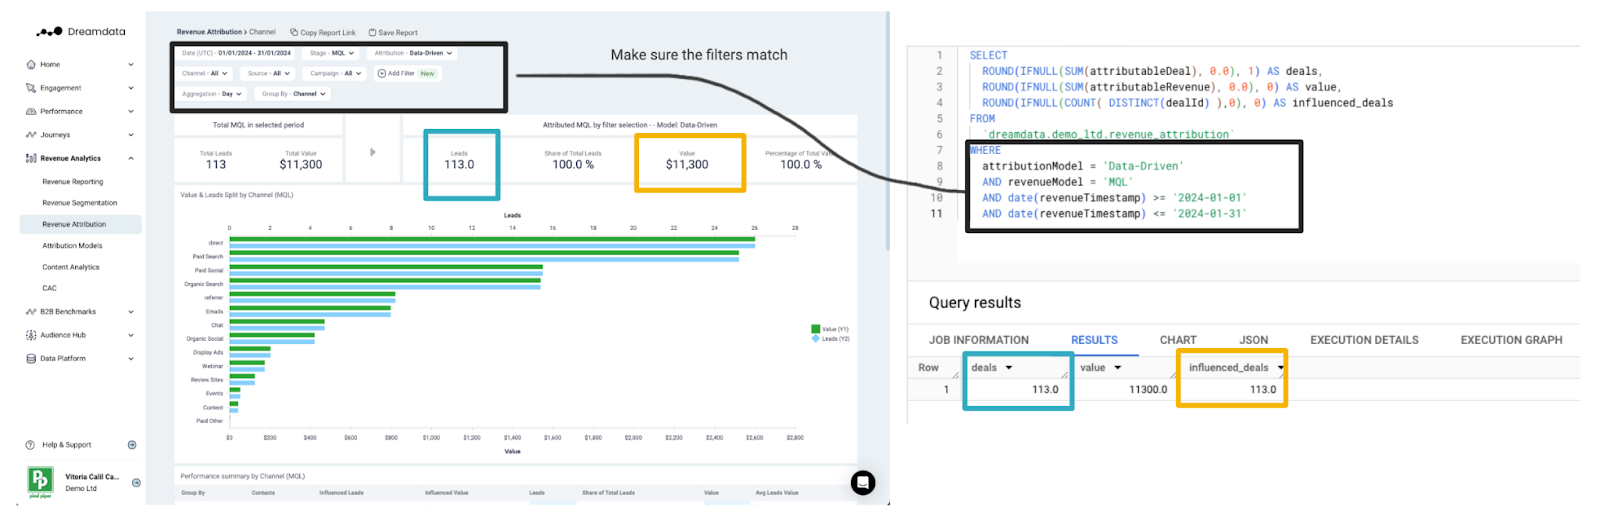
To ensure consistency, compare the output from this query with the values presented in the Dreamdata Revenue Attribution report. Discrepancies can arise if different filters are applied in the query versus the report. Therefore, aligning your filters is crucial for accurate comparison and analysis.
1.3 Querying Attribution Across All Stage Models by Channel: Expanding Your Analysis
After mastering a single stage model queries, the next advancement is to analyze data across all stage models, with an emphasis on categorizing by channel.
This step of our guide will introduce a comprehensive query designed to calculate deals, revenue, and influenced deals for all your stage models, specifically filtering for the Data-Driven attribution model.
Understanding the Metrics:
- Deals: We calculate the sum of
attributableDeal, which represents the proportion (ranging from 0 to 1) of a deal attributed to the session in each row. This means if a session is partly responsible for a deal, it gets a corresponding fraction of the credit. For instance, a session might be attributed 20% (0.2) of a deal. - Value (Revenue): This metric sums the fraction of revenue attributed to each session. For example, if an MQL has a total value of $100, and a session is attributed $20, this $20 is what we sum up here.
- Influenced Deals: We count the unique Deal IDs to determine the total number of deals attributed to sessions. This helps us understand how each session has influenced on deal closure
-- -- 1.3
  SELECT
    revenueModel,
    channel,
    ROUND(IFNULL(SUM(attributableDeal), 0.0), 1) AS deals,
    ROUND(IFNULL(SUM(attributableRevenue), 0.0), 0) AS value,
    ROUND(IFNULL(COUNT( DISTINCT(dealId) ),0), 0) AS influenced_deals
  FROM
    `dreamdata.demo_ltd.revenue_attribution`
  WHERE
    attributionModel = 'Data-Driven'
    /*
    when pasting this query in Looker Studio, if you want to use dynamic date filters you will need to change
    '2024-01-01' to PARSE_DATE('%Y%m%d',  @DS_START_DATE)
    and  '2024-01-31' to PARSE_DATE('%Y%m%d',  @DS_END_DATE)
    */
    AND date(revenueTimestamp) >= '2024-01-01' --  PARSE_DATE('%Y%m%d',  @DS_START_DATE)
    AND date(revenueTimestamp) <= '2024-01-31' -- PARSE_DATE('%Y%m%d',  @DS_END_DATE)
  GROUP BY
    revenueModel,
    channel
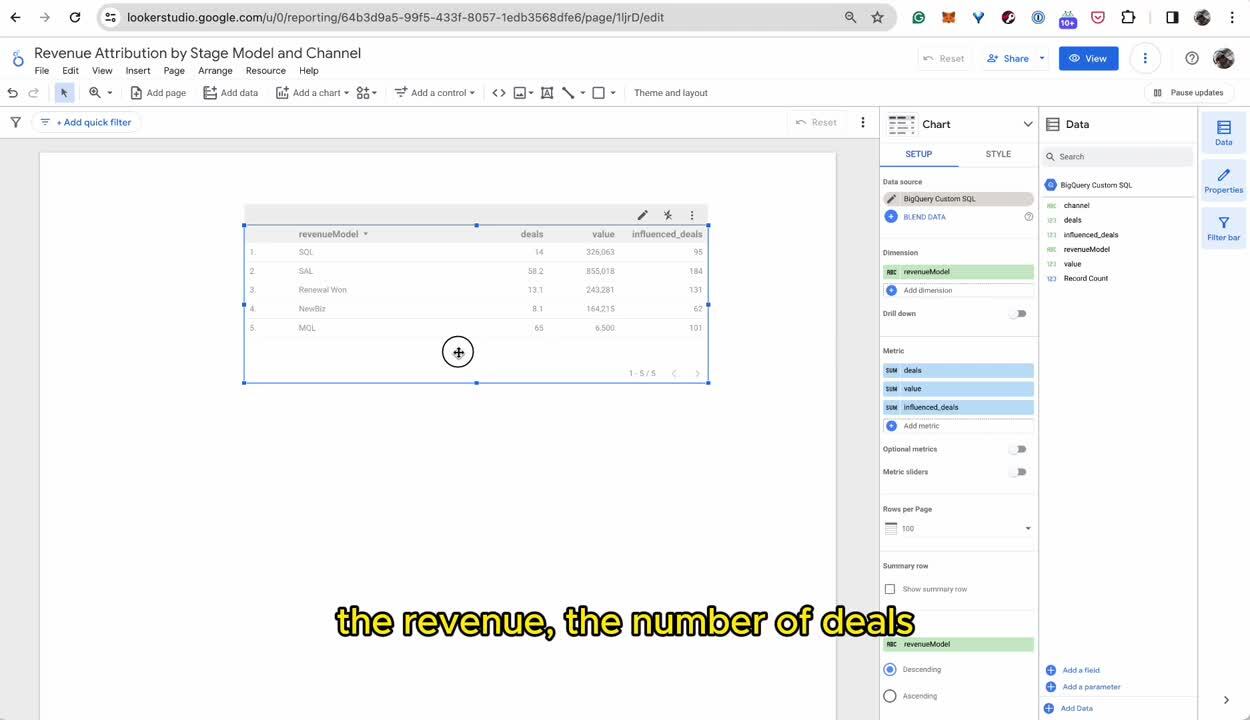
This query approach provides a granular view of your revenue attribution by channel, offering insights into the performance of each channel across different stage models.
After running it, you will have an output similar to what we see in the screenshot below.
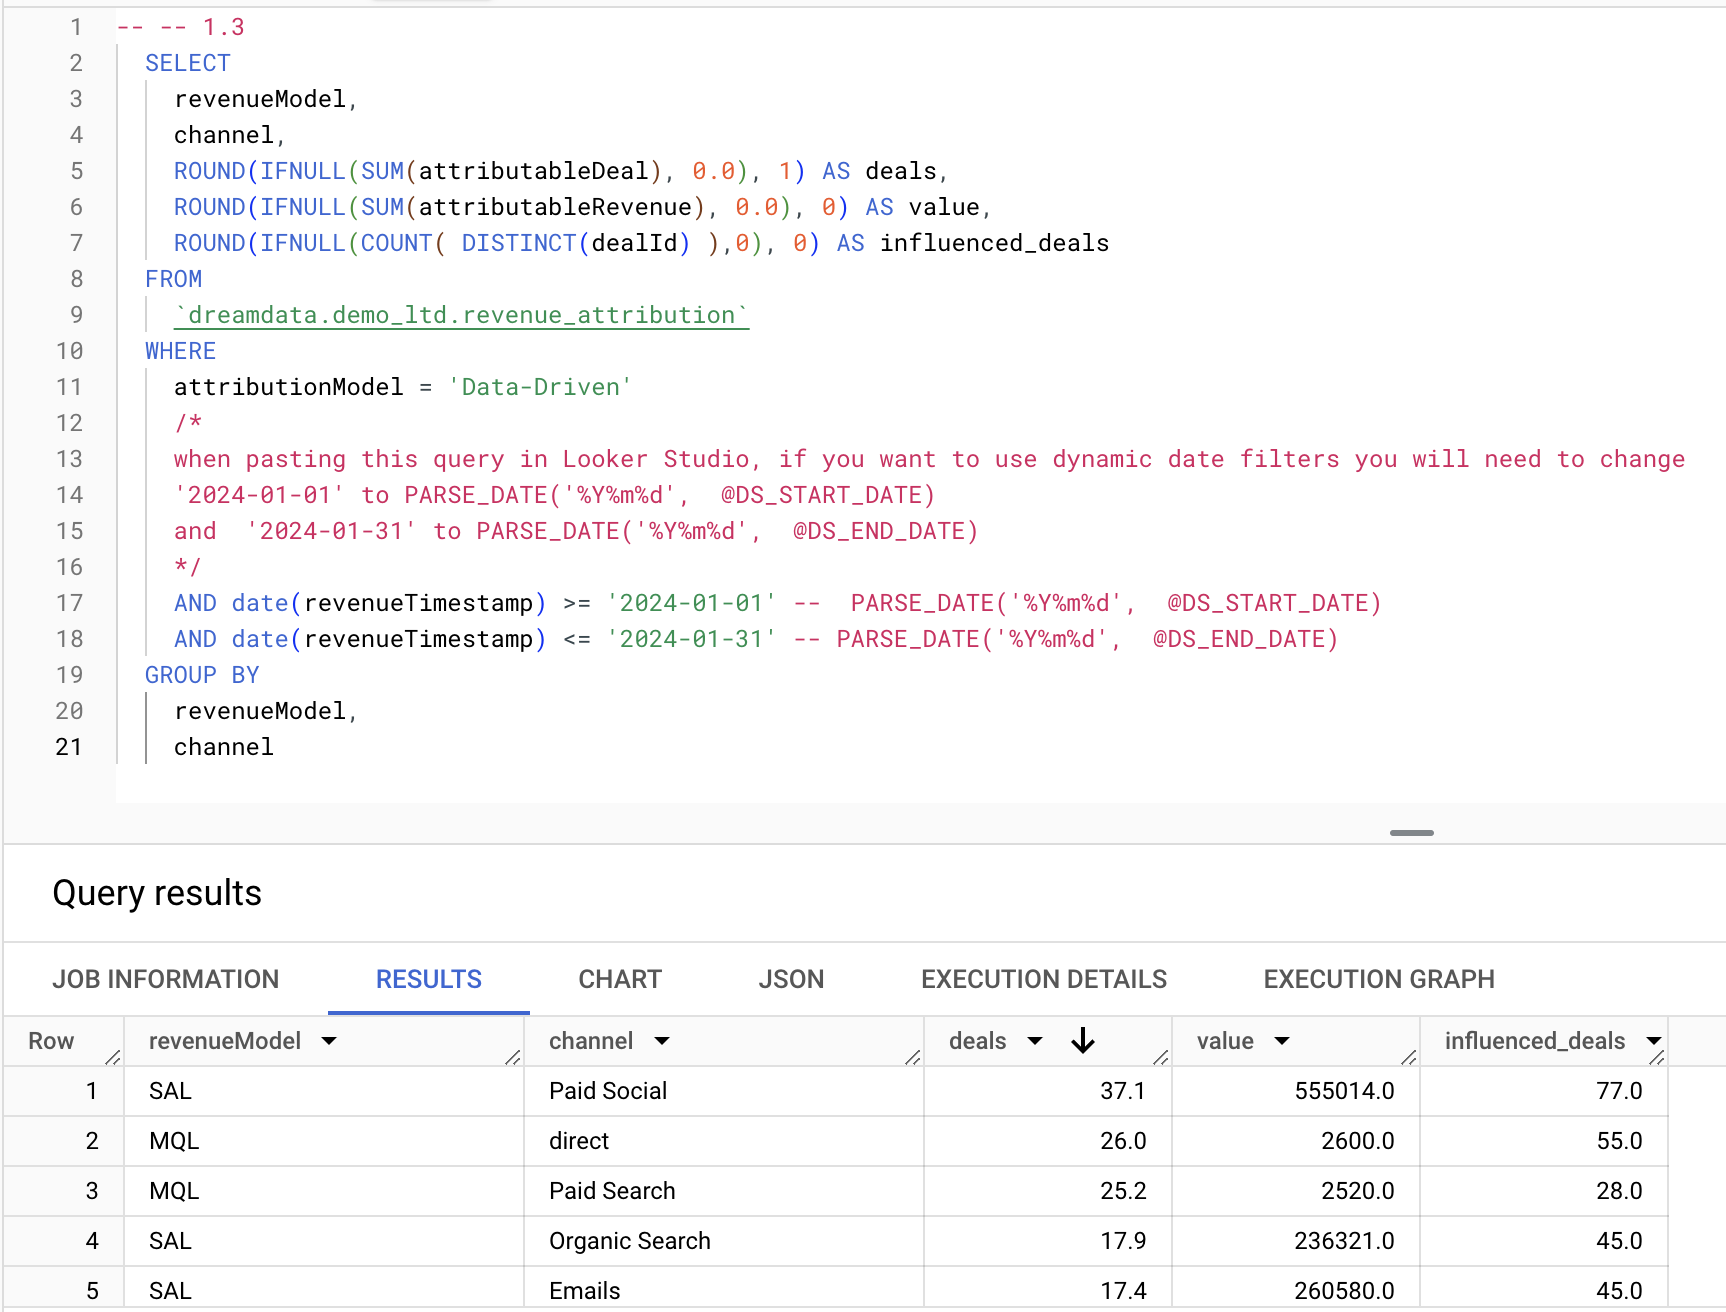
The query outlined above is designed to have better integration with Looker Studio pivot tables, facilitating the visualization process. However, you can use a different query approach to reach the same results.
Note that there is a comment about filtering dates dynamically in Looker Studio. We will explore this concept in the next part of this guide.
Step 2: Visualizing Data in Looker Studio
Now that we have the query ready, we can create a Looker Studio report to plot a table like the one we showed at the beginning of this guide.
You can watch the video below to follow the step-by-step on how to replicate the report.
Conclusion
By following these steps, you'll unlock powerful visualizations into your revenue attribution, allowing for more informed decision-making and strategy optimization.
Don't hesitate to get in touch with us at friends@dreamdata.io for any questions, feedback, or requests you might have.