Setting up LinkedIn Ads
 Updated
by
Andreea Mahu
Updated
by
Andreea Mahu
To populate your Paid Overview, Cost, ROAS (Return On Ad Spend), LinkedIn Engagements and LinkedIn Ads dashboards with data, you need to enable the LinkedIn Ads integration.
Click here to view a guide on how to set up tracking for LinkedIn Ads.
Setting up LinkedIn Ads
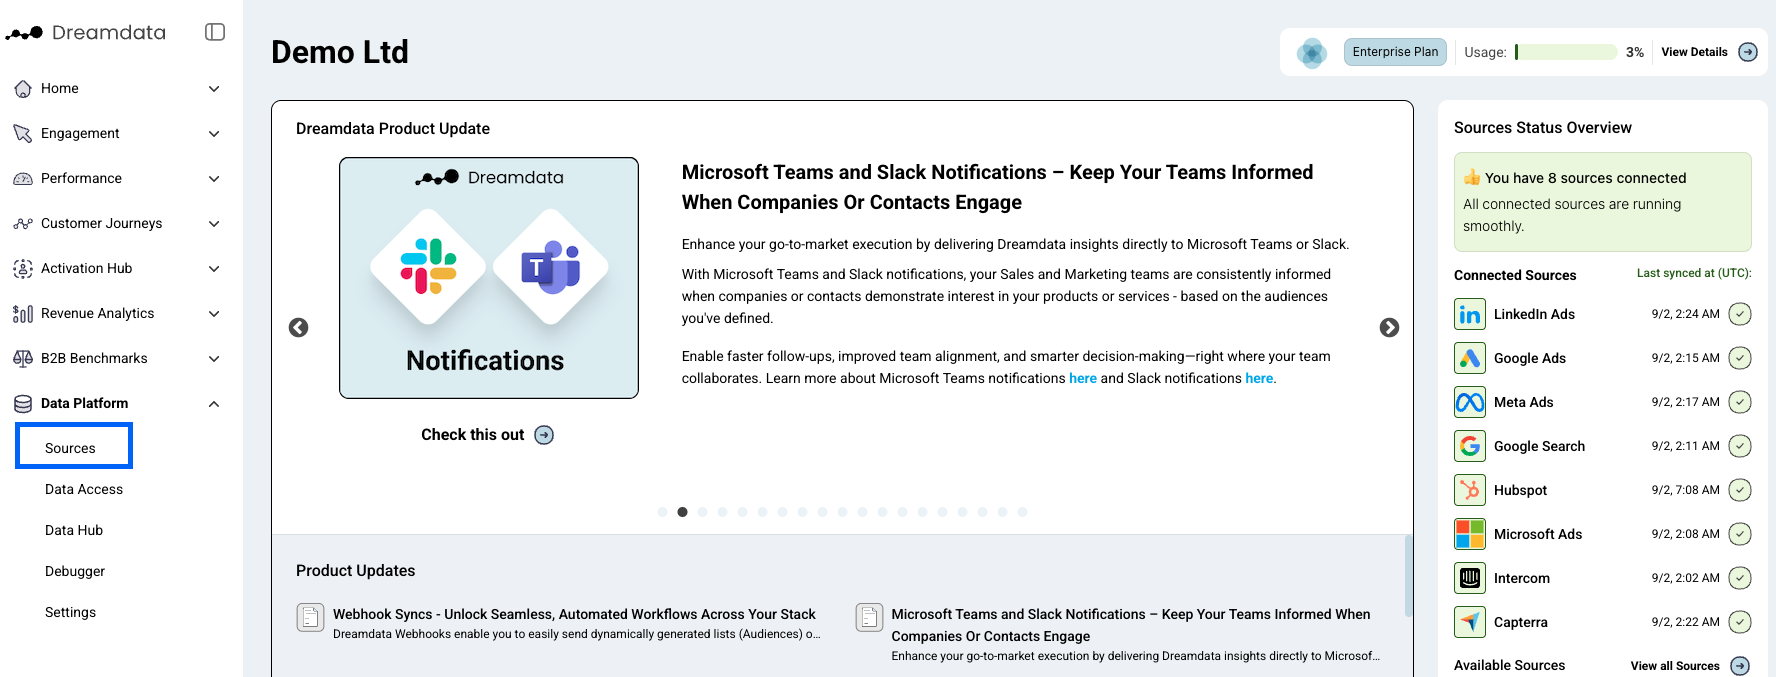
- In Dreamdata's main menu on your left side, click on Data Platform and then select "Sources".
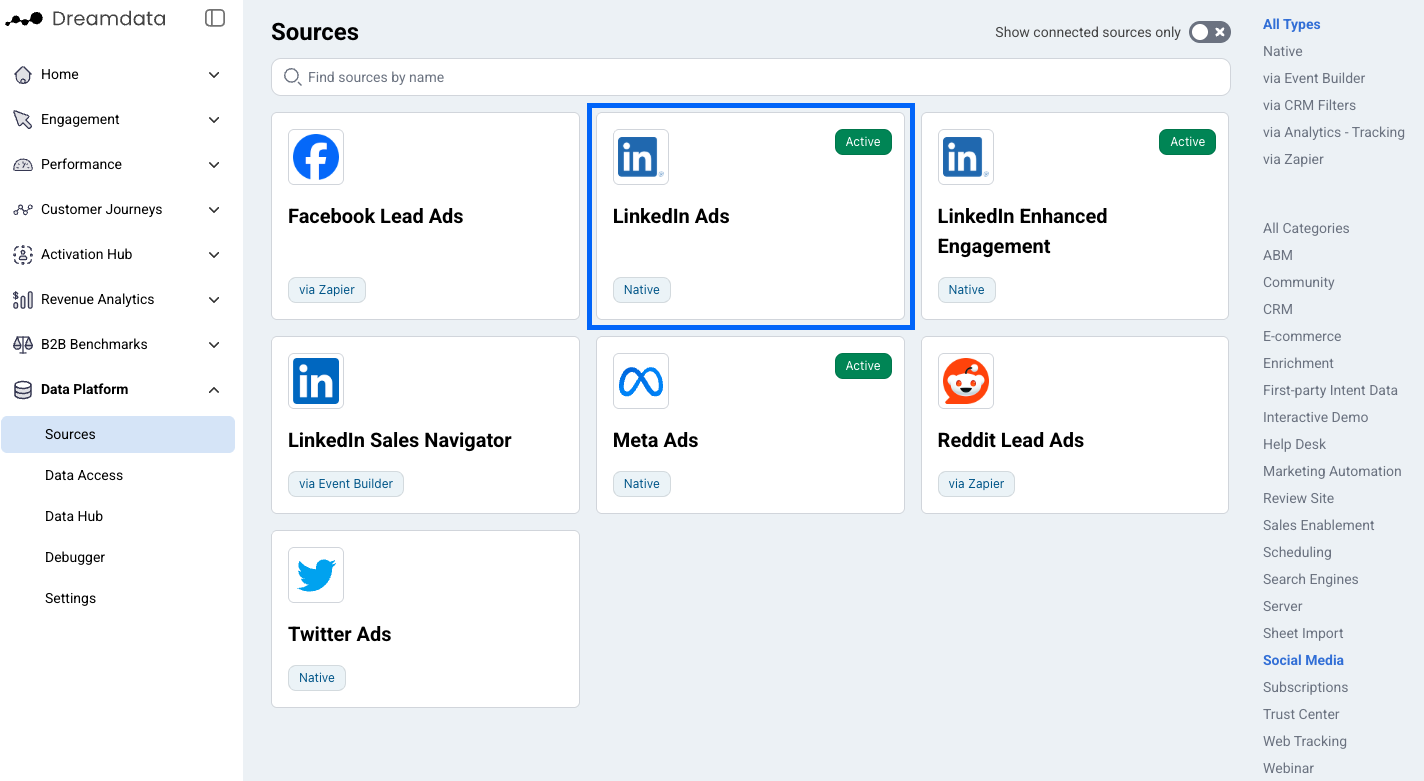
- On the Sources page, select "LinkedIn Ads" by either going to the "Social Media" category or by searching for it in the search bar.
- Click "Enable" (a new tab will open).
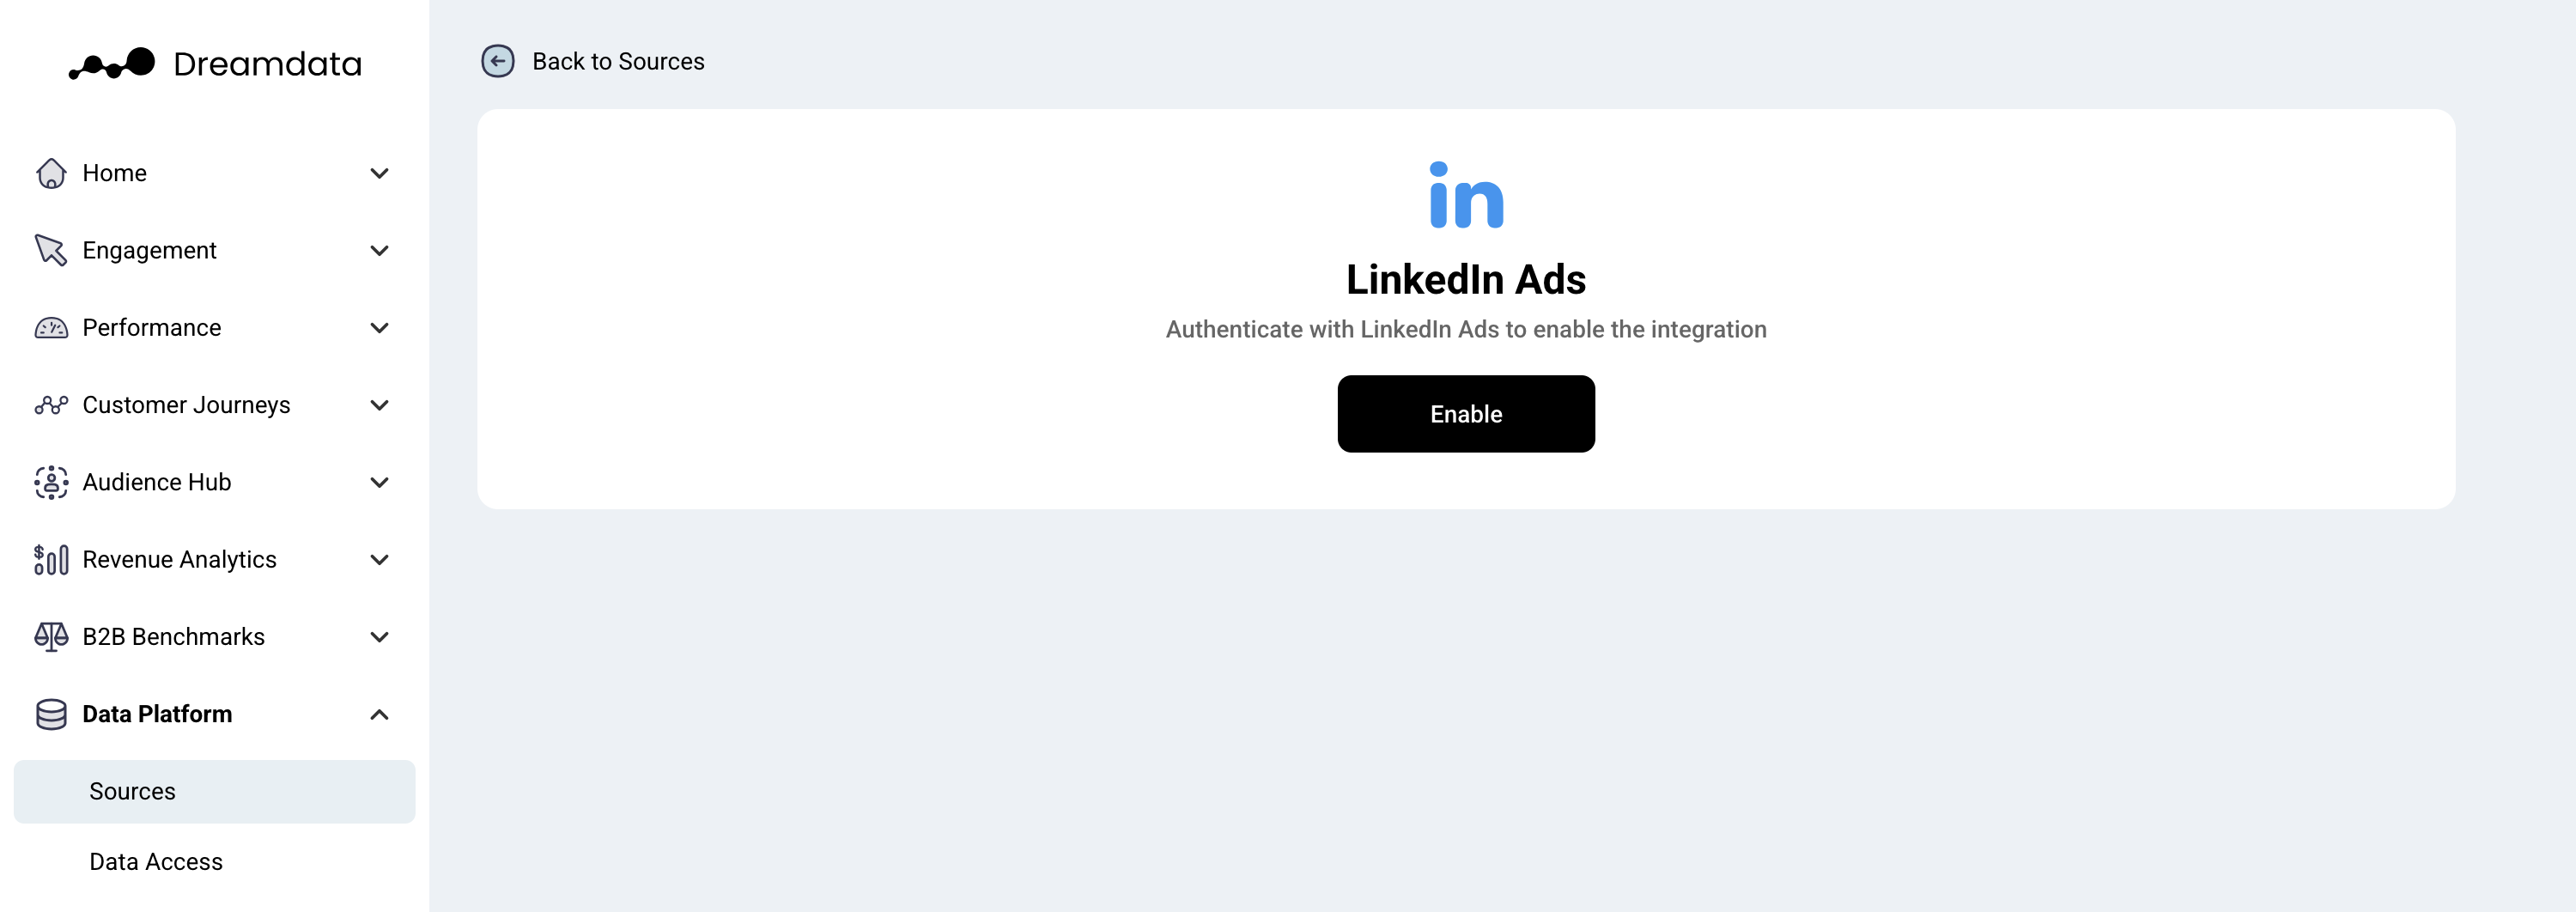
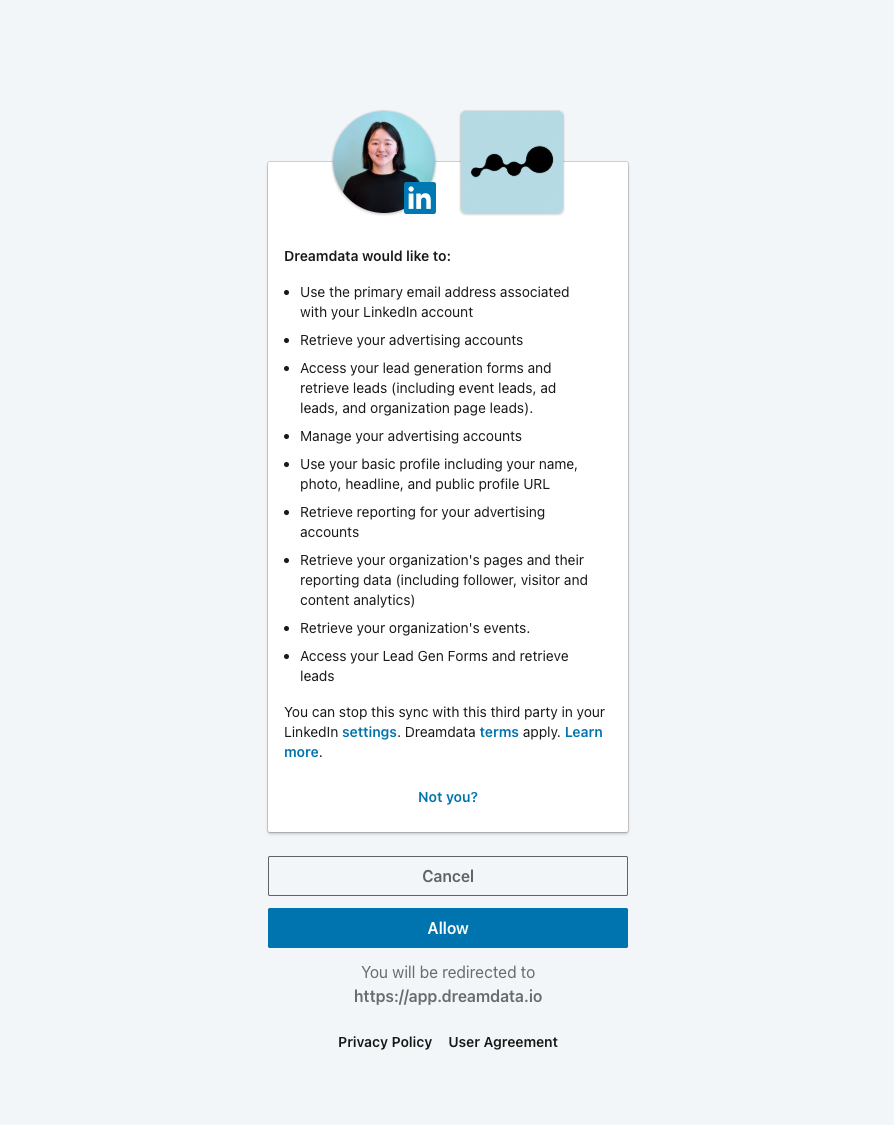
- In order to proceed you need to be signed into your LinkedIn Account.
- Grant Dreamdata access by Clicking "Allow".
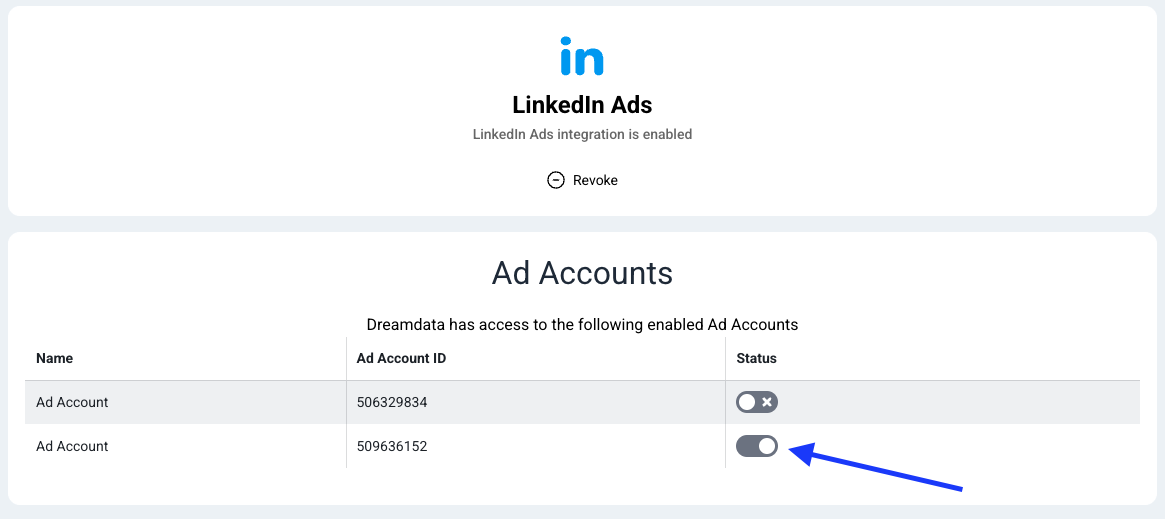
- Make sure relevant accounts are set to "Active" by enabling them
- Check if you have permissions for us to pull your lead ads data.
- You're all set 🔥 It can take up to between 24 – 48 hours before data begins to appear.
Find our best practices for setting up Linkedin utm parameters here.
What data do we get from LinkedIn?
- Daily campaign performance report. It contains daily cost, clicks, impressions of each campaign and we retrieve all historical data available for your plan.
- 90/60/30/7 days company engagement report. It contains metrics (ad impression, ad engagement, organic impressions, organic engagements ) that represent how well companies engage with your LinkedIn efforts. We retrieve maximum 90 days history from the moment of the integration. This metrics from LinkedIn are aggregated for each time window (90, 60, 30, or 7 days). Learn more about the definition of these metrics here.
- Lead ads form submission data. This data includes:
- Leads collected directly from an ad (last 90 days).
- Leads collected from a company page (all historical data available for your plan).
- Leads collected from an organization’s product page (all historical data available for your plan).
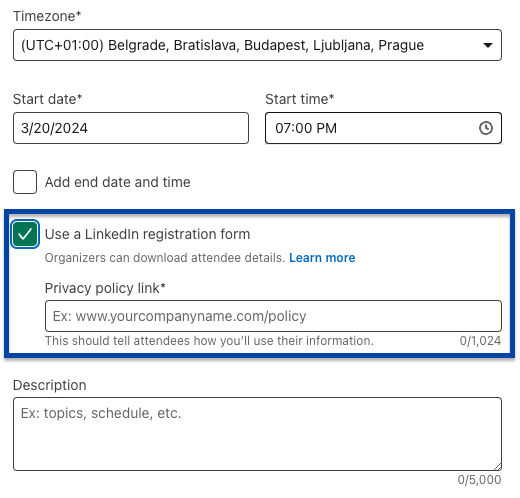
- Leads collected from an event page (all historical data available for your plan, only if hosted on the organization account). This will only work if the "Use a LinkedIn registration form" checkbox is selected for each event.
Because most of the interactions with LinkedIn campaigns happen only on LinkedIn platform, it is very difficult to get a complete picture of how your LinkedIn campaigns perform. In order to bridge the gap, we build engagement events based on the company engagement report and include them in the customer journeys. Check out the definitions here.
How does Dreamdata integrate the LinkedIn company engagement data?
The accuracy of the results depends on your usage, privacy settings, and other limitations imposed by LinkedIn. While engagement data is distributed fairly across the period in which it occurred (example: the last 90 days for the first data retrieval), it may not reflect specific times, and the dates may carry some inaccuracy. In most cases, this will not have a significant impact on revenue attribution.
Dreamdata can retrieve LinkedIn Organic Engagement and Impressions and Ad Engagement and Impressions data from the past 90, 60, 30 and 7 days. Due to LinkedIn privacy settings and other restrictions, Ad engagement data is often reported at the campaign level.
As data is not instantly available, small discrepancies may be found between LinkedIn and Dreamdata reports.
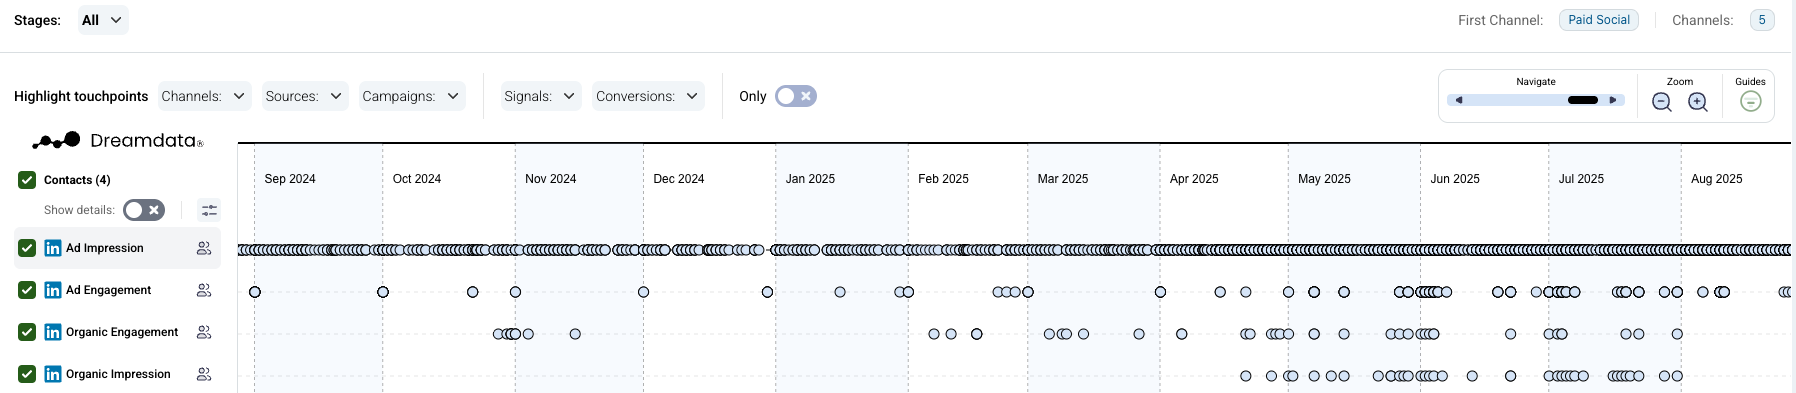
Where can I see LinkedIn company engagement data in Dreamdata?
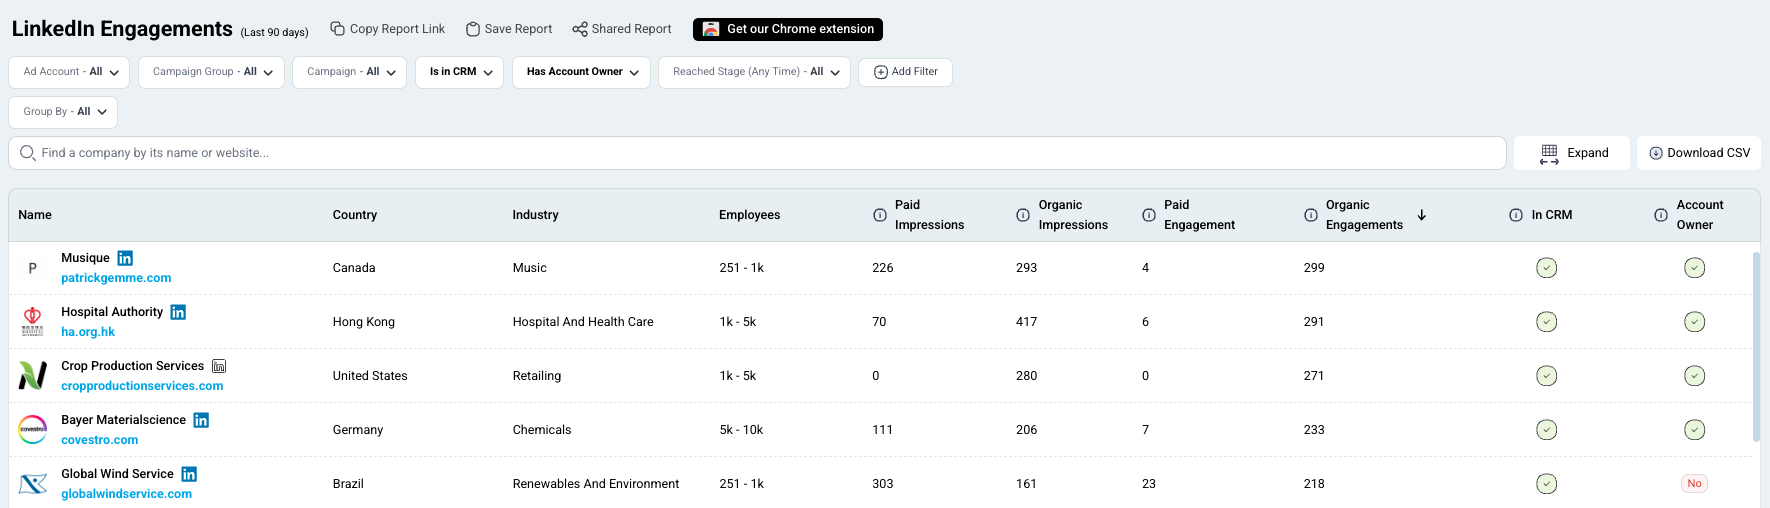
- You will be able to see company engagement metrics in Customer Journeys -> LinkedIn Engagement report
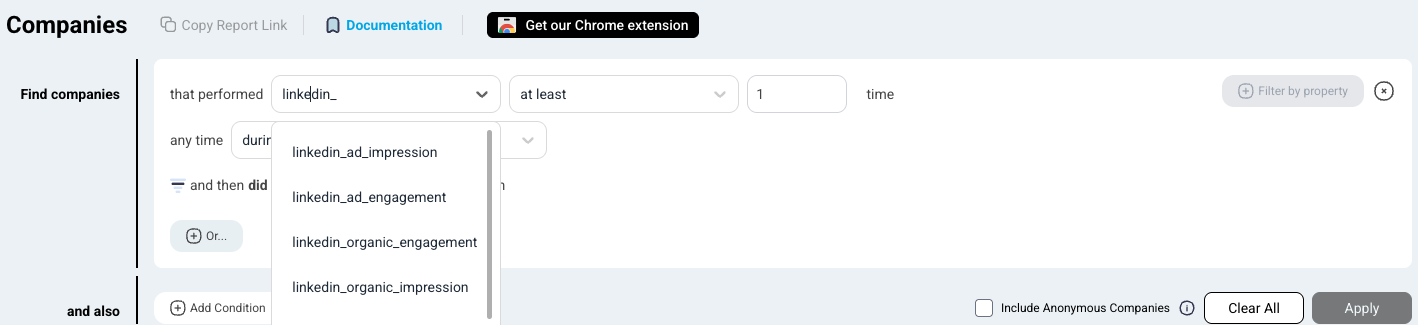
- In Customer Journeys -> Companies you will be able to filter by companies that performed linkedin_organic_engagement, linkedin_organic_impression, linkedin_ad_engagement and linkedin_ad_impression events
- You will also be able to see LinkedIn engagement in the detailed company journey view