Facebook Ads
Facebook Ads
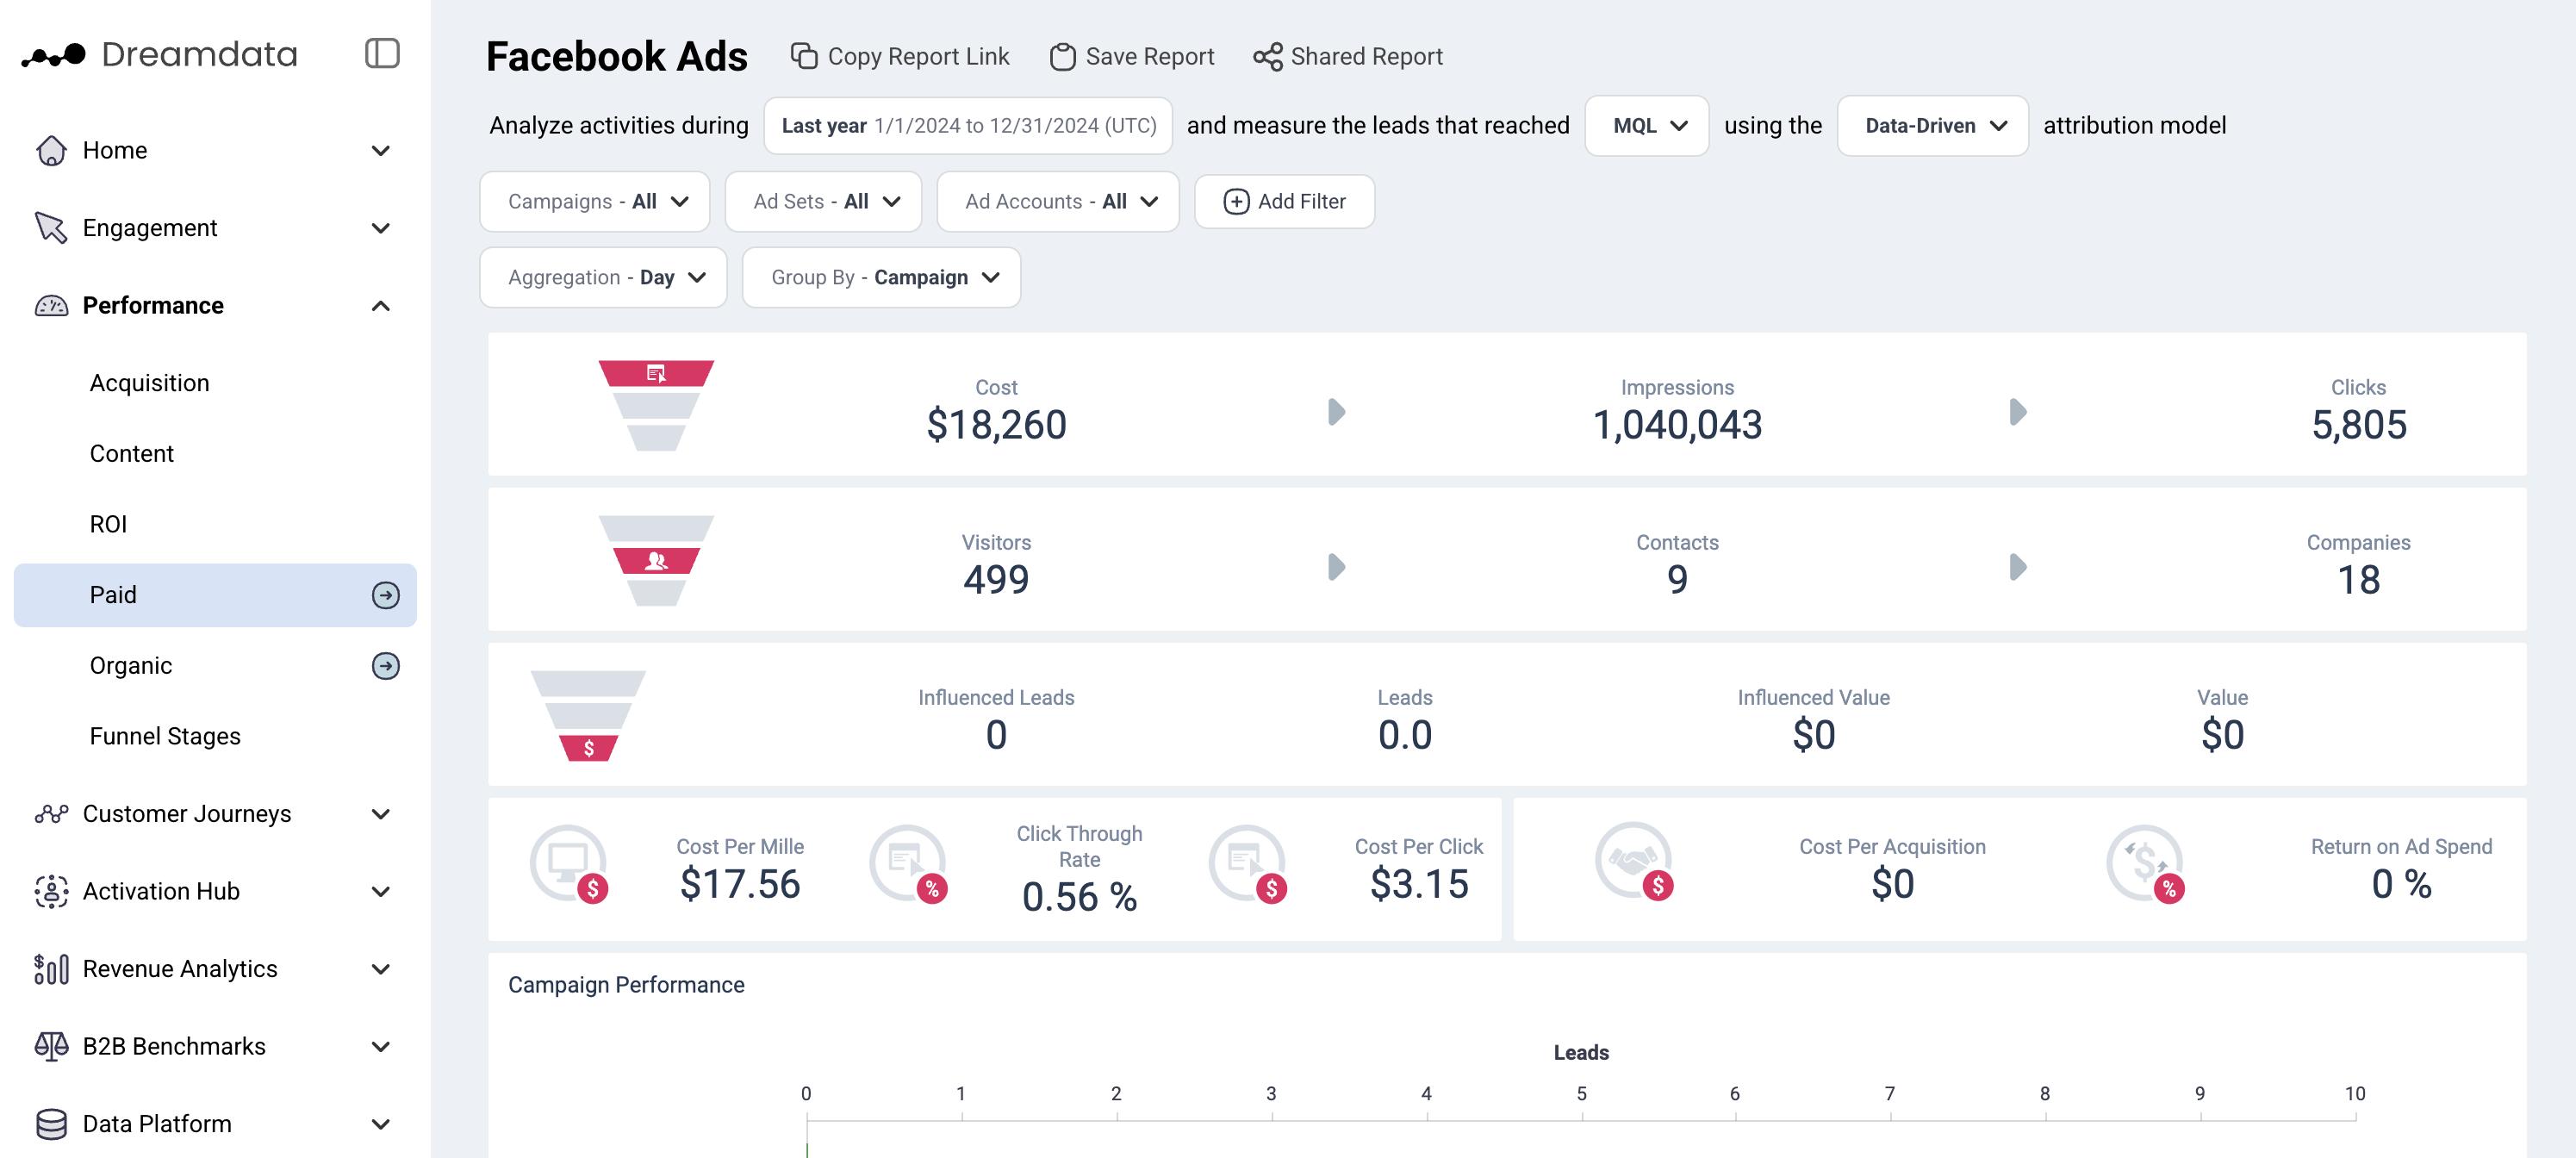
With this dashboard, we give users all the info they need to understand how their Facebook Ads are performing, particularly in regards to generating Revenue. From the overall funnel, down to campaign and search query level, you get the full perspective and can make data supported decisions and strategy.
Note that Instagram Ads traffic uses the Facebook Ad Network, and will be shown under the Facebook Ads Performance page.
Filters
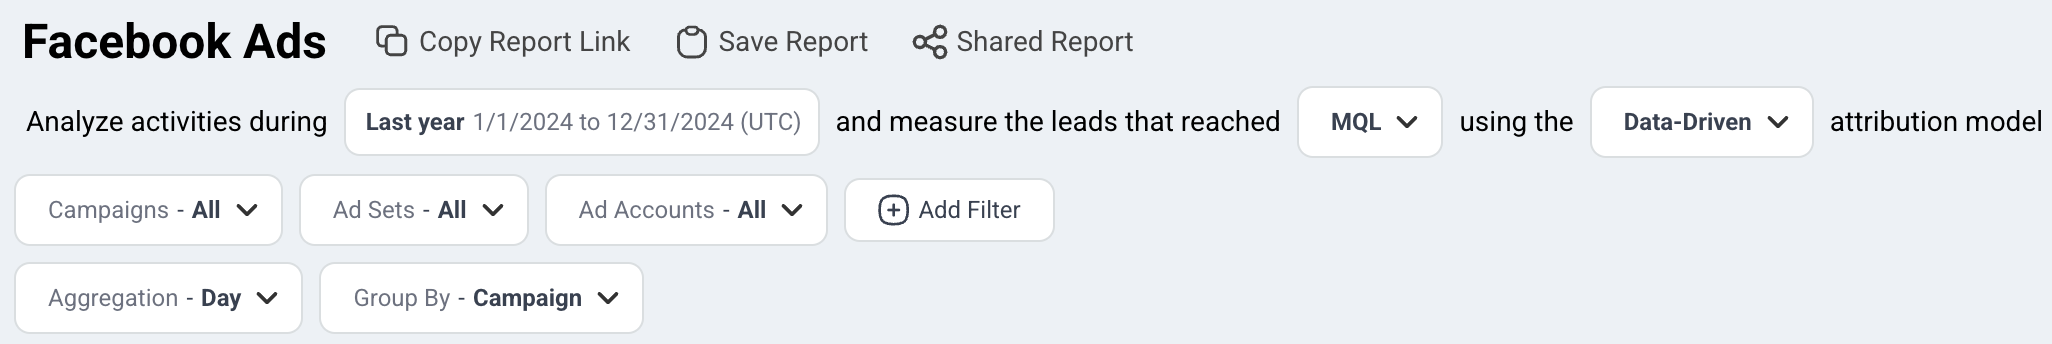
Date: Set the time period you want to investigate
Stage: You can select your preferred pipeline stage. Read more about the Free Tier Stages here
Attribution: Choose the attribution model which is meaningful for your analysis
- First Touch
- Last Touch
- Linear
- U-Shaped
- W-Shaped
Campaigns: Choose the campaign you want to investigate
Ad Sets: Choose the ad sets you want to analyse
Ad Accounts: Choose the ad account/s you are interested in
Aggregation: Set the time frames you wish to display your data in
Group By: Choose your preferred option
- Campaign
- Ad Set
- Ad Account
Note: Date is referring to the time period when visitors/contacts interacted with any Facebook Ads
Metrics
Cost: The total spend on Facebook Ads
Impressions: The number of times your Facebook Ads are shown. Each time your ad appears on someone's feed it is counted as an impression.
Clicks: The total amount of clicks recorded by Facebook Ads
Visitors: The number of unique users who had a website session which originated from Facebook Ads during the given time period
Influenced Leads - the total number of leads that had recoded interaction with your marketing efforts
Contacts: The number of visitors who we have been able to attach an email to their user id
Companies: The number of companies who are attached to Contacts, or the number of companies in your CRM who can be attached to any visitor traffic (anonymous)
Cost per Mille (cpm): Cost per thousand, this calculation is used to denote the price over 1,000 impressions
Click Through Rate (ctr): Clicks/Impressions
Cost Per Click (cpc): Total Cost/Clicks
Cost Per Acquisition (cpa): Total Cost/ Attributable Deals
Return on Ad Spend (ROAS): Total Attributable Revenue/ Total Cost
Funnel Overview
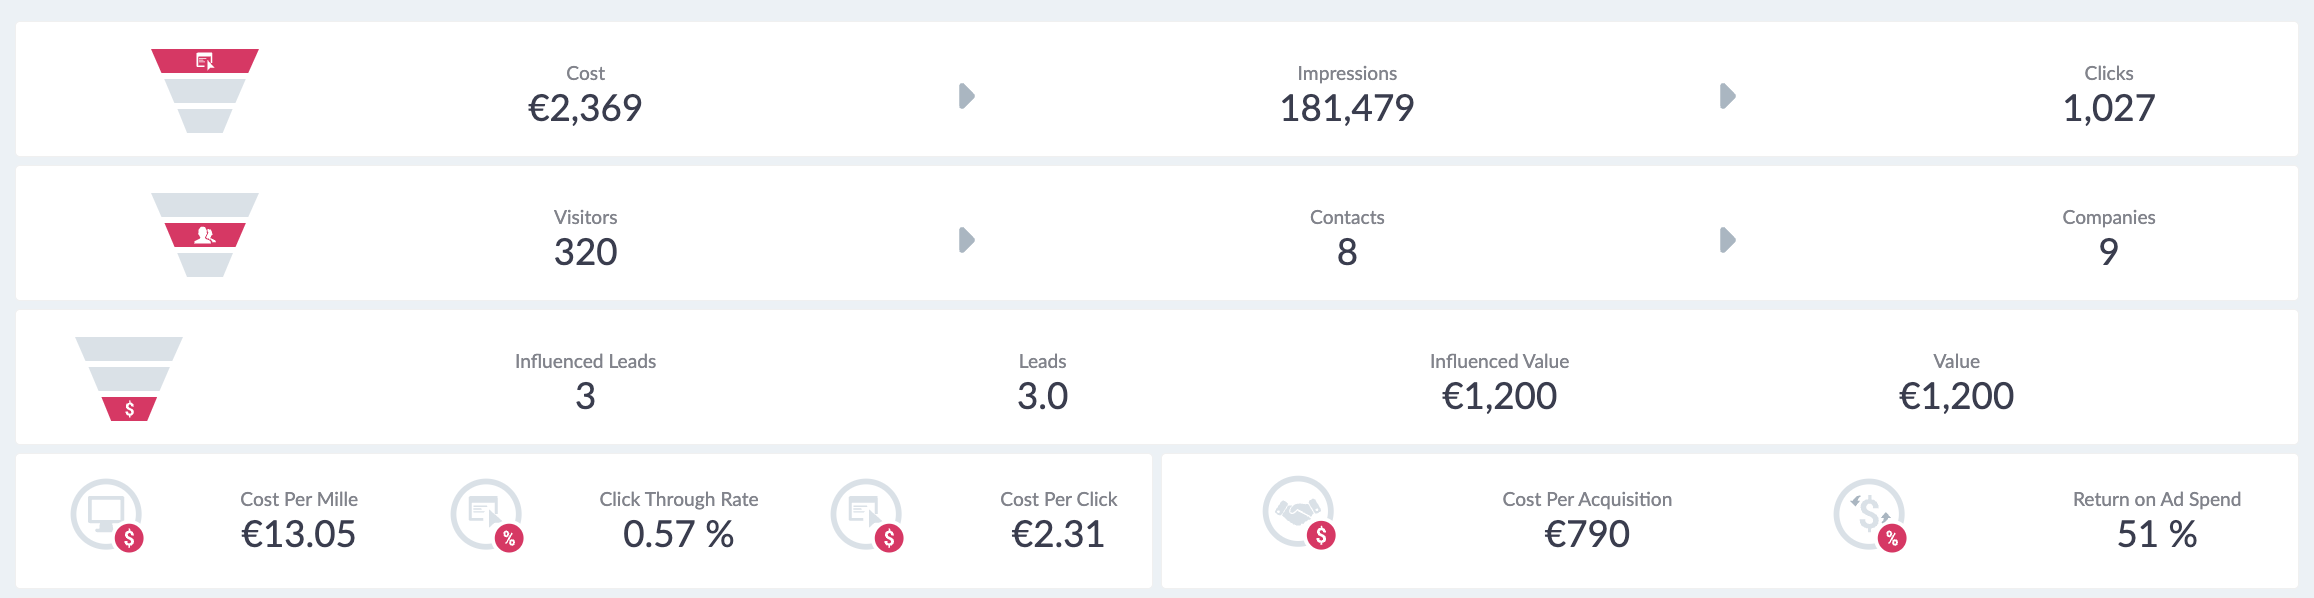
Cost → Impressions → Clicks
In this first section, we provide the top of the funnel for your Facebook Ads for the given time period. This data is pulled directly from Facebook Ads through our integrations.
Visitors → Contacts → Companies
In the next section, we give an overview of the traffic from Facebook Ads which is based on the Tracking script we have on your websites.
Influenced Leads → Leads → Influenced Value → Value
In the third section, we provide Influenced Leads and Influenced Value. Influenced Leads represent the total number of leads that had recorded interaction with your marketing efforts and Influenced Value represents the total revenue that came from these Leads. Important to mention that these two metrics are not controlled by your selected attribution model.
Remaining metrics: Leads and Value are attributable metrics, they display Facebook Ads performance data based on the filters selected.
To calculate these numbers, we first look at the pool of contacts/companies that visited a Facebook Ads based on the dates/filters. Once we have that group, we see what deals were closed after their visit, up to today's date. More importantly, we are only looking at deals where we have a recorded history of sessions; Attributable Deals. This pool of attributable deals will make up the basis for this section. For each of these deals and all their sessions, we will run the Attribution Model you have selected so each session is given a deal and revenue amount.
For both Attributable Deal and Value (revenue), we then provide the sum of these amounts for each session that contains a Facebook Ad, depending on which Attribution Model you have selected.
Note: When using First Touch/Last Touch you will get a round Deal number, as a deal is either First Touch Paid or Not. While with Linear, W-Shaped or U-Shaped you will get a fraction of a deal as most Paid Touchpoints will make up a fraction of the sessions on a deal.
Cpm → Ctr → Cpa → ROAS
On the fourth row, we provide percentages for some common KPIs, most important Return on Ad Spend.
Campaign Performance
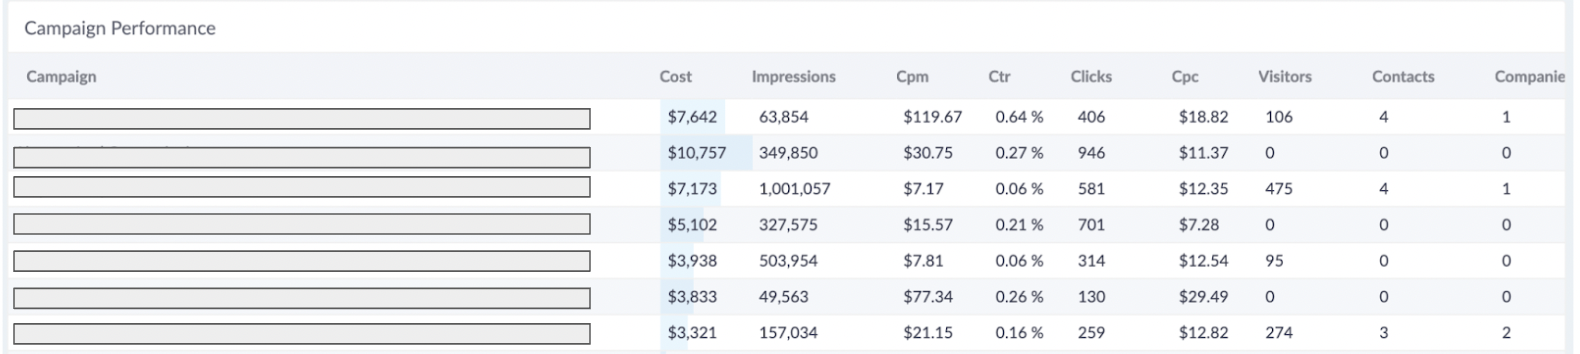
In this table, we list all the Campaigns in Facebook Ads that were running during the time frame specified. We provide all the metrics for each campaign making it easier for you to compare and find out which performed and which ones did not perform.
Note: If you click on the Title Campaign Performance in the top left corner of the Table, it will open a larger view, which is better for navigation.
Campaign Performance over time
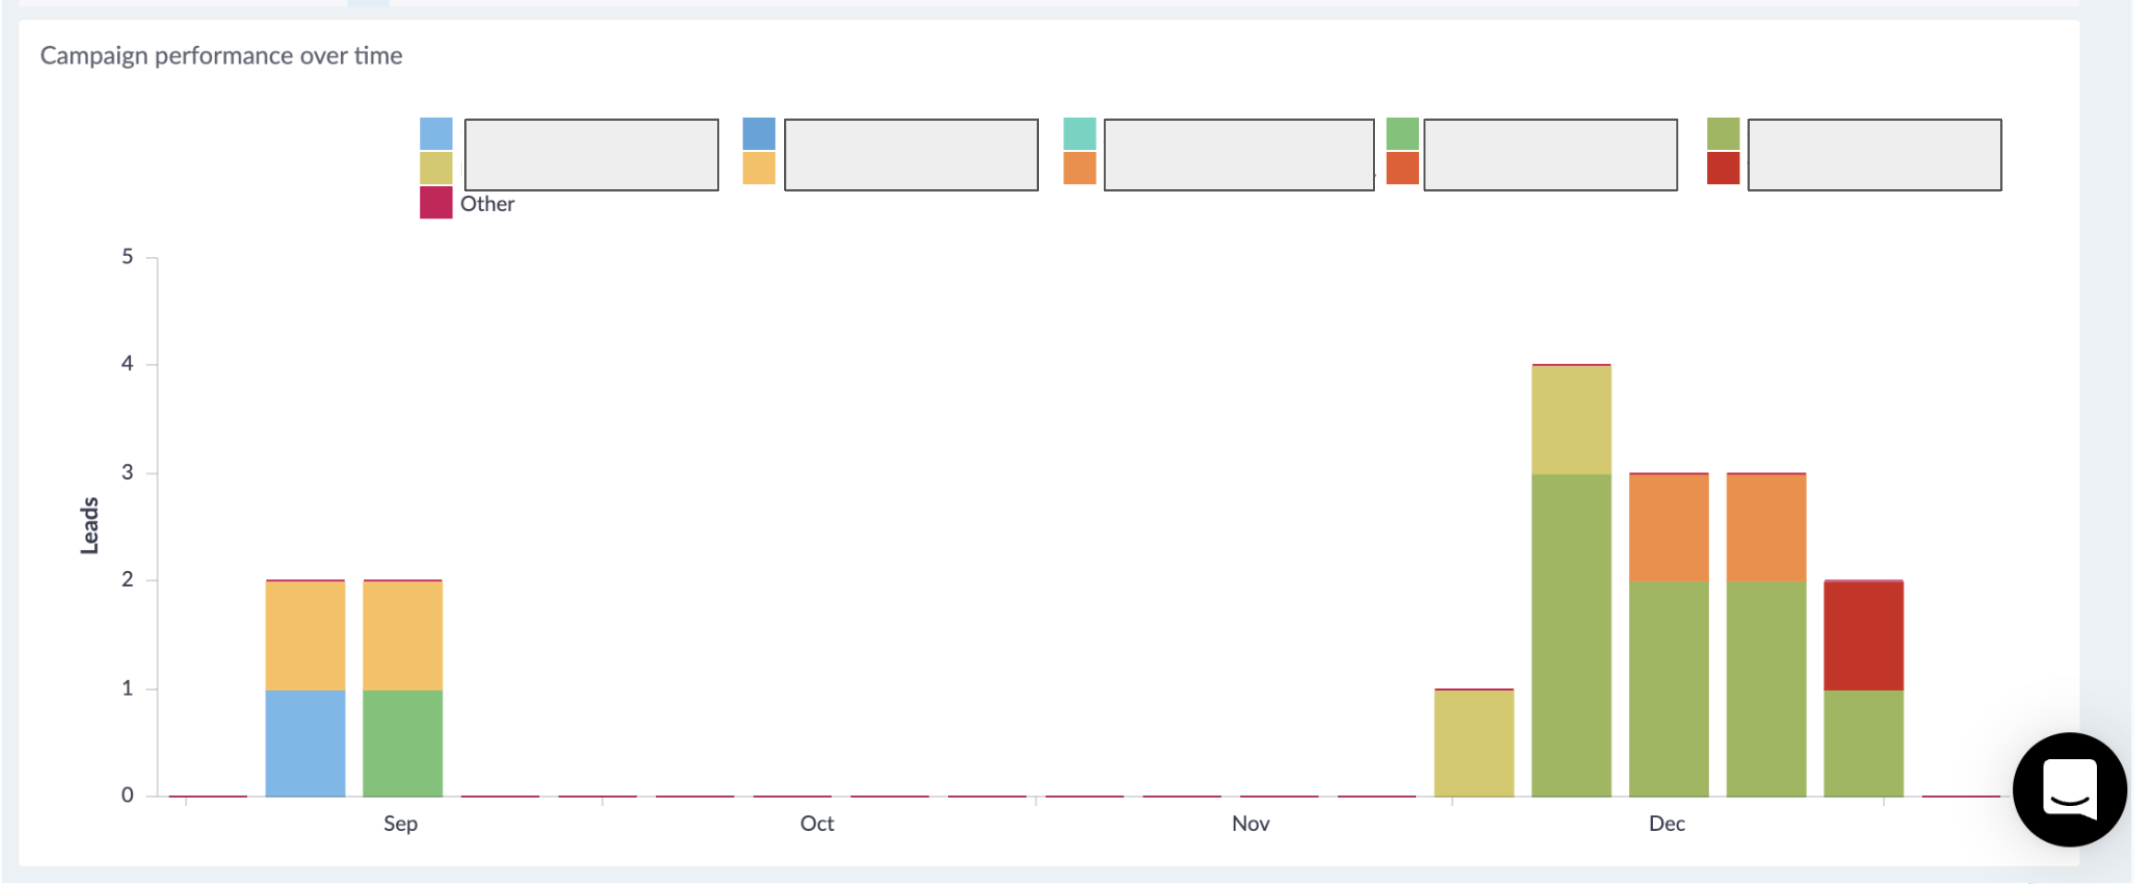
We provide a graph showing the development of your Facebook Ad Campaigns and their Return on Ad Spend over the period of time specified in your Filters. Use the Aggregate filter to breakdown the X-Axis as you wish e.g. (day, week, month).
This graph makes it easy to see which Campaign is performing best, but also it shows how long it generally takes for a campaign to win the deals. To do that, select specific Campaign and set Aggregation Filter by days. This will allow you to get detailed analysis on unique campaigns.
Note: time frame is key so you can give enough time to your campaigns to create value.
FAQ
Why are the click numbers in Facebook ads report lower than what I see in Facebook Ads Manager?
Dreamdata tracks 'Link Clicks'. If you notice a higher number in Facebook’s native reporting, you are likely looking at the 'Clicks(All)' metric.
While 'Link Clicks' only measures traffic to your destination URL, 'Clicks(All)' includes social engagements like likes, shares, and profile clicks. You can read more about the difference between these two metrics here.