Explainer for Stage Averages on the Revenue Reporting report

.
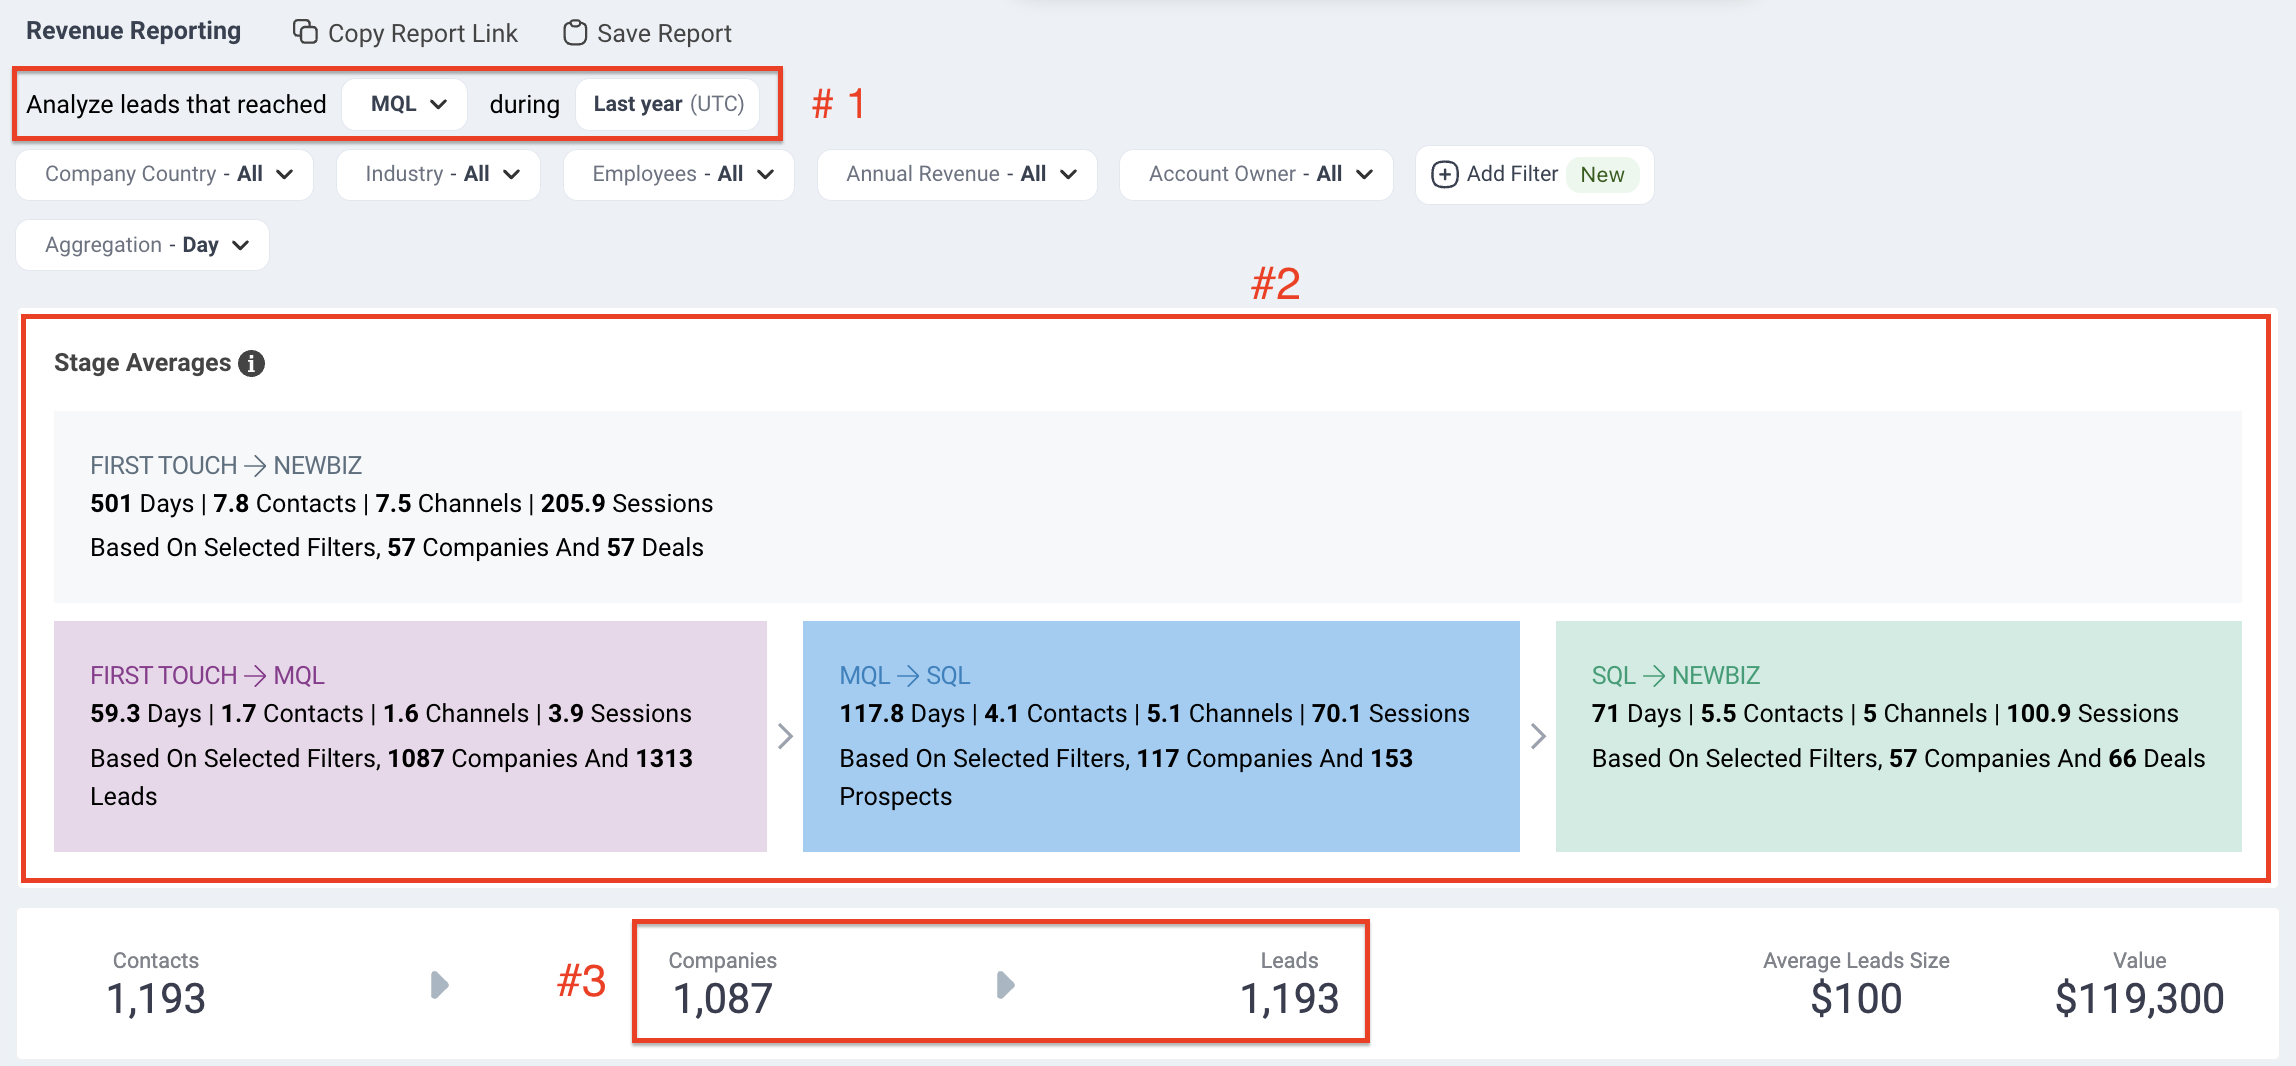
The Stage Averages (everything in box #2) are all related to the cohort specified by the two top filters in box #1, only. They include the Stage filter and the time period filter.
In this example, we have selected the MQL stage as the one we want to analyze, and Last year as the time period when the leads must have reached the MQL stage. You can see in box #3 that the total number of companies represented by all detected leads is 1,087.
So, what can we say about this cohort? And how are the metrics calculated?
- FIRST TOUCH → NEWBIZ (the light gray box)
In this box, you find the total number of companies from the cohort (1,087) that have transitioned all the way from First Touch to NewBiz. Note: It is important to keep the concept of “transitioning” in mind for all the subsequent insights. So, in this example, the marketing and sales team managed to “transition” a total number of 57 companies from First Touch to NewBiz. And for exactly these 57 transitions, you can read the stage averages for journey time, contacts, channels and sessions. - FIRST TOUCH → MQL (the pink box)
In this box, you find the total number of companies from the cohort that have transitioned from First Touch to MQL. In this example, of the total number of leads in the cohort, where both a First Touch has been registered and MQL was reached, the total number of companies represented is 1,087. And for exactly these 1,087 transitions, you can read the averages for journey time, contacts, channels and sessions. - MQL → SQL (the blue box)
In this box, you find the total number of companies from the original cohort that have transitioned from MQL and reached SQL. In this example, only leads representing 117 companies transitioned from the stage MQL to SQL. Once again, for exactly these 117 transitions, you can read the transition averages for journey time, contacts, channels and sessions. - SQL → NEWBIZ (the green box)
And finally, in this box, you find the total number of companies from the original cohort that, since then, have transitioned from SQL and reached NewBiz. In this example, only prospects representing 57 companies transitioned from the stage SQL to NewBiz. And as previously, for exactly these 57 transitions, you can read the averages for journey time, contacts, channels and sessions.
.
Please note: In this example, it is only the original transition to MQL that must have happened within the time period specified. The two subsequent transitions, meaning from MQL to SQL and finally from SQL to NEWBIZ may have happened later than the specified time period. Additionally, the Leads count in the First Touch → MQL box counts ALL Leads, meaning this count includes leads acquired outside selected time period. Also, please note that the Leads count in the First Touch → MQL box is not restricted to the selected time period, so it includes leads outside the selected time period.